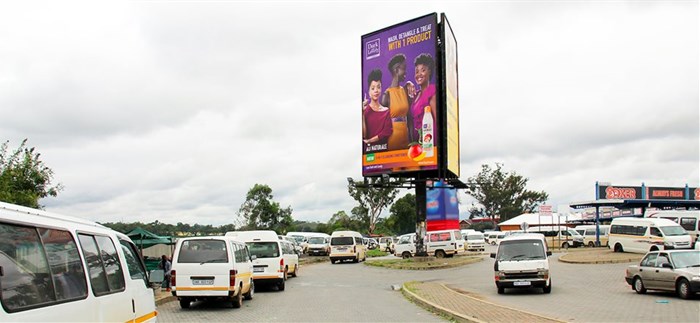
At Mamela we often say, 'there's no silver bullet' when it comes to marketing your brand. There is no singular platform that magically does it all. Based on your campaign KPI's we strategically plot a journey of touch points that ushers the consumer down that well known conversion funnel. The right messaging, in the right place, at the right time allows brands to ensure more purposeful targeting, less wastage and ultimately, higher conversions.
In a recent case study, we saw six times higher footfall when we had a billboard present near the distributor.
A tech client was looking to introduce an entry level laptop into the mass market, an untapped market for them with huge potential.
There were two objectives to this campaign and the one could not exist without the other:
- Build trust and credibility around the brand and product
- Drive feet to distributors to purchase
Trust, as we all know, plays a very large role within the township consumers’ purchasing decision. With “word-of-mouth” being one of the most successful marketing tools within this market. There are, however, other platforms that build trust, OOH being one of them.
In order to understand the full impact of our media mix we created a strategy that would allow us to compare results with and without OOH present. We had four billboards strategically placed at four different township malls all in proximity to several distributors. The billboards were flighted one month prior to the second phase of our strategy: Drive consumers to stores to purchase.
Phase two of the strategy was to geo-fence over 40 distributors, including the areas with billboards, and serve location-based advertising to mobile devices seen within these geo-fences. When the consumer clicked on the mobile ad it took them to Google Maps with directions to the nearest distributor.
Side note: It is important to mention that our mobile ads were served across high and low LSM groups whereas the billboards were only township based. Why is this important? Because different markets have different behaviours, and to understand the results, we must understand the context. After years of running location-based mobile campaigns within the township market we have collected enough data to define engagement benchmarks. For your higher LSM markets the benchmark is around 0.5% click through rate (CTR), but in the 'click conscious' mass market, the benchmark is around 0.3% CTR.
Our total impressions were over 14.6 million, which gave us a CPT of R19… talk about more bang for your buck!
When looking at the overall results for this campaign, we saw that four out of the top five best performing geo-fences, with regards to online engagement, had a billboard present. As you can see below in Table 1 the CTR around our billboards outperformed the benchmark by a whopping 173%.
Our location services are incredibly accurate which enables us to geo-fence the actual stores and detect a device once in store. Our system only collects the device ID to ensure full POPIA and GDPR compliance. Store visit rate (SVR) is then calculated on impressions to actual store visits. For this campaign we recorded a total of roughly 3,800 store visits during the two-month campaign period.
As you can see in Table 2 the locations with OOH present outperformed the SVR benchmark by over 350%! When comparing it to the average SVR of the other locations it is difficult to deny that the OOH has had an incredibly positive impact on the footfall.
In summary this campaign was a great success. When looking at the results holistically (OOH and mobile) we managed to drive a total reach of over 650,000 individuals over three months. Our total impressions were over 14.6 million, which gave us a CPT of R19… talk about more bang for your buck!
If you would like to find out more about our township touchpoints and how we can help your brand navigate this thriving market, then check us out at www.mamelamedia.co.za and get in touch.


