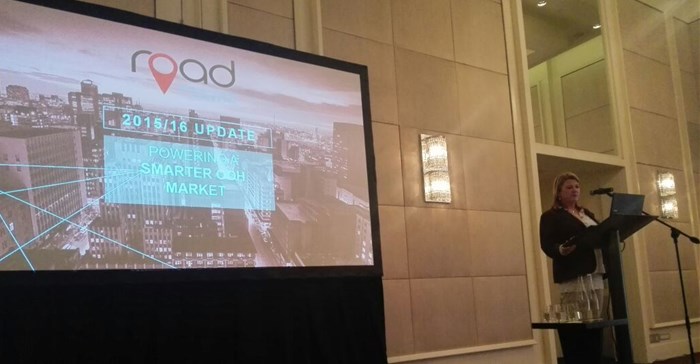
"Out of Home (OOH) is just becoming such an explosive media opportunity for all of us," said Trish Gilford, a freelance media strategist working with the Outdoor Media Council (OMC), when she took the stage to introduce a presentation on the Roadside Outdoor Audience Data (Road) measurement system at the end of last month.

Trish Gilford, a freelance media strategist working with the OMC.
“Gone are the days of just having a billboard. We now have digital billboards – small sizes, big sizes, etc. – which are all over South Africa. A lot of them have come in from overseas and are now being implemented on our side. It's an extremely powerful medium which has the ability to catch numerous eyeballs on a massive scale, allowing us to connect and engage with consumers anywhere and everywhere.”
So, it's no surprise that historically the selection, the planning, and the measurement of OOH was considered as very hard. According to Gilford, that is now changing, thanks to the Road research. “We have various times and location data and new technology that has moved our OOH industry into new opportunities that we've never had before. It now gives us a currency that we can actually work with that will benefit both the media owners and agencies. We can finally integrate OOH properly into our media strategies,” said Gilford.
Methodology overview
Ruchelle Mouton took us through the methodology overview. “OOH is notoriously a difficult medium to measure. Not only do we have moving audiences but we can also have moving structures. For example, we can have taxis or busses and digital signs because they are obviously dynamic. So it's a very complex landscape to measure and for that reason, we've employed a very sophisticated model, and we're using an integrated approach that makes use of big data, visibility analysis, travel patterns, and we've really gathered expertise within these fields.”
Mouton explained that they use satellite imagery provided by a company called Digital Globe. There are six satellites that orbit around the globe and take images from the landscape and from there they are able to extract data from the satellite images. They use the satellite imagery to track vehicle traffic to understand the direction of movement, how people move around within cities and towns and more importantly, they are able to track traffic intensity.
The travel survey incorporates 50,000 respondents on an annual basis from communities of 8,000 and above – from the survey, they obtain demographic information and public transport usage, but more importantly, they obtain origin and destination information for each trip type that they measure. Based on the survey and the satellite imagery, they are then able to model trips.
“We also understand that just because we understand traffic, doesn't mean that traffic equates to an ad contact. For that reason, we employ visibility analysis. We calculate around each structure within the system's visibility zone to determine if someone is at least able to see the logo on the site,” adds Mouton. Based on the visibility and the movement of direction and all the big data that they obtain, they are then able to get to an audience measurement which is converted into OOH ratings.
In a nutshell, the research gives them a complete representation of how people move across different cities and through towns. “What is very sophisticated about this is that it is very robust. The days of traffic counts are over,” she concluded.
Fieldwork efficiencies and innovation
Sanna Fourie from Ask Afrika, who is responsible for the data collection for the OMC, was up next and touched on a few quality control measures that ensure that the delivery quality data to the industry.
“The OMC methodology in South Africa is quite unique compared to other countries. This is due to the fact that we don't make use of any tracking devices as Roger Percy had patented the use of GPS technology for OOH research until 2021. The questionnaire is administered through a computer activated personal interview on a tablet device. Trips and destination information are obtained from the respondent from recall based on the trips taken the past seven days,” she explained.
Many quality checks were added along the way and these processes were based on learnings of unknown factors that they found in the field. These key learnings were covered in Fourie's presentation at Pamro 2017:
Fourie also spoke about innovations implemented to improve the quality of data. From adding geo-fencing as a feature on their devices to investing in field management software tools that helped them to access the tablets in the field from head office. They also managed to implement covert recording to record specific questions, so that they could listen to the way in which it was phrased, and how it was answered.
Insights and data
Next up was Lauren Shapiro from Kuper Research, responsible for the technical oversight of the project, who took us through some of the insights and data that they will be able to share with their clients. Shapiro started by explaining that they normally roll data out over a period of three years. They previously released 2015's data and will now combine 2015 and 2016's data, which will be released to those who have the Quantum Software available.
Shapiro said they will have just over 30,000 people interviewed this time around. Shapiro continued to say that the plan includes having three rolling years – so when they have the 2017 data, they will then be working on a sample size of 45,000. Shapiro says considering the way people travel they have to have a robust and diverse number of people so that they can understand how these people travel, and how they go passed billboards. Since fusing the two data sets, there have been a couple of factors that have come into play:
- New universe weightings - necessary to include District Municipalities as a weighting variable for both the 2015 and 2016 waves.
- Updated big data - Updated digital globe images for 2016 have been added and included in calculations and modelling.
- Richer fieldwork information - Richer origin and destination information allows for a greater diversity of routes travelled.
- Weights to data - Various weights applied to the data to balance the information between the two waves.
Benefits
- Larger samples and broader trip data.
- Better inputs into the process of modelling routes
- More robust and richer results
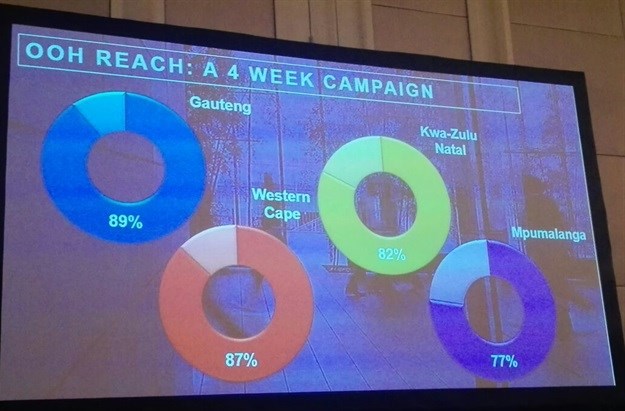
“OOH is big. Every week the sites that are measured by Road deliver 21,113,067,975 impacts in four weeks and reach 18.8 million people with an average frequency of 113. In total, a massive 288 million trips are taken per week, which averages 11 trips per person,” says Shapiro.
Shapiro says benchmarking in OOH is now possible. Going forward they will be creating packs of different regions, different target markets, so clients can get a feel of what can be a good rating and a good reach, etc. – depending on who your target market is.
Howard Lonstein, marketing manager of the Outdoor Network, concluded the presentation by talking about the benefits of this research to planners, strategists and advertisers.
Outputs
- The scope of information is aligned with industry standards, providing metrics which can easily be applied, compared and integrated into media plans, along with other media channels.
- A solution to understand how and who consumes OOH - impacting the effectiveness of campaigns through better contextual ad placement and accountability through the rich audience insights.
- Different media strategies can now be implemented to improve in OOH's ability to meet varying campaign and brand objectives.
Improving spend on OOH
- Through media metrics which are aligned with all key channels.
- OOH can integrate with other media channels.
- Through better alignment of OOH to campaign objectives and goals.
- Audience-driven planning.
Lonstein says deeper insights of a geographical audience and mobility location brings focus and understanding, and it allows people to have better insight into how to reach audience sets and pockets of audiences on a national basis. By developing a currency, they now have efficacy – they can talk about reducing media wastage, and probably the biggest thing in advertising, it's all about context. “It all starts with a currency, with numeracy and with the efficacy of what we are delivering to you. As a planner, there are other aspects too, like reducing time wastage, because you can improve what you're actually looking for and synthesise it to a specific section, in an environment, on a national spread. The pre-aspect of this is having the same language, the same numeracy and the same aspects that other media has,” explained Lonstein.
Media planners can now demonstrate the value of OOH in various ways. The strategy and implementation come about being able to integrate the marketing plans and the numeracy that people can now use to look across the spectrum. That affords them that opportunity to get a bigger chunk or a bigger size of the budget. This means better resources, better allocation and better spend he said.
The research is funded by the current OMC members, and it's available through Quantum Software. For more information on the OMC and the Road measurement system, click here.


