Towards the end of 2022, the BRC agreed to release new channel codes to the industry to allow for a better understanding of total viewing and share of viewing for all content flighting on TV sets.
Previously the industry, with the exception of broadcasters who always had access to the data, had access to broadcast TV data only. Broadcast TV includes total viewing of any content viewed on broadcast channels but excludes any viewing via streaming or other devices on a TV set.
In recent years, there has been an exponential growth in viewing content via steaming or other devices connected to a TV set.
Users can select whether they want to analyse data based on Total TV or Broadcast TV. With that in mind, there are a couple of important points to remember:
- Total TV or Broadcast TV is only for content viewed on a TV set - this is key. The current collection of viewing data does not collect someone viewing on their cell phone, for example, unless the content has been cast to the TV set.
- The analysis should only be used for informing strategic understanding of viewer behaviour. Total TV should not be selected when planning or projecting data.
- The key metric for Total TV or Broadcast TV is share and more importantly average share.
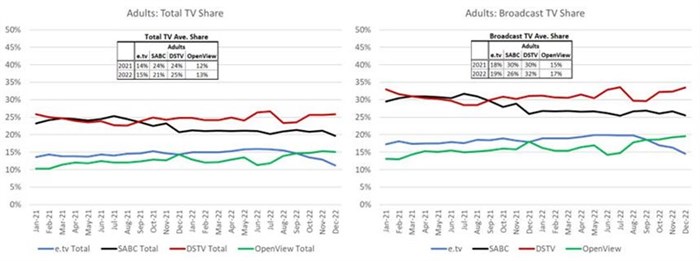
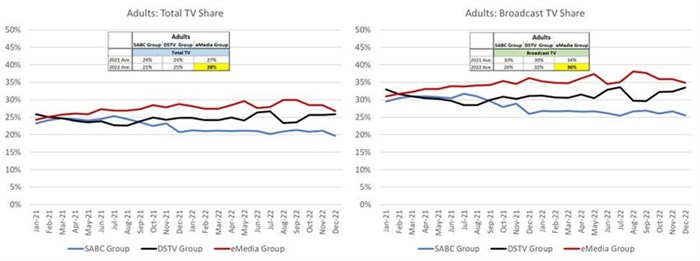
The graphs below show how the share of station groups have changed over the last two years and who commands the largest share of Total TV vs Broadcast TV. In the case of All Adults, DStv leads followed by SABC. The trends across Total TV vs Broadcast are very similar however the Station Groups percentage share decreases when measured against Total TV. We can see DStv overtaking SABC in Sep-21. We can also see OpenView has overtaken e.tv in Sep-22. For the graphs below only the major channel groups have been included.
- In 2022, the major Channel Groups combined share of Broadcast TV was 94% therefore 6% of All Adults were viewing other broadcast channels.
- In 2022, the major channel groups combined share of Total TV was 74% therefore 26% of All Adults were viewing other broadcast channels or content via streaming, catchup or other devices on a TV set.
How does the data help to inform planning and understanding changing viewer habits?
- Users need to analyse the data using their key audience targets.
- The data will enable users to determine the share of key channels against Total TV Content vs Broadcast TV Content. Station groups, as used in the example in this article can be analysed or a set of individual channels can be analysed. The results will provide an indication as to whether or not the audience is more or less likely to be viewing content via streaming or other devices.
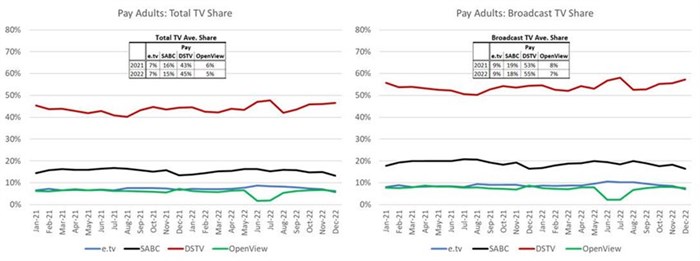
Looking at Pay vs Free to View (FTV) Adult Audiences, one can clearly see how the Station Groups share of Total vs Broadcast TV changes.
- Against the Pay Adult Audience DStv is key. On average in 2022, DStv had 45% share of Total TV and 55% share of Broadcast TV.
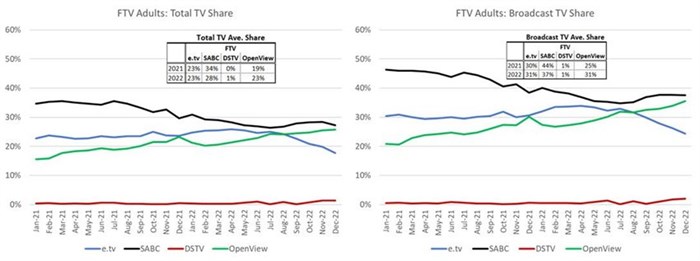
- Whilst for FTV, SABC remains top of the pile, the gap between OpenView and SABC is getting smaller. In 2022 on average, the SABC was commanding 37% (down from 44% in 2021) share of Broadcast TV and 28% (down from 34% in 2021) share of Total TV. OpenView, on the other hand, was commanding 31% (up from 25% in 2021) share of Broadcast TV and 23% (up from 19% in 2021) share of Total TV. Amongst FTV adults OpenView is clearly challenging SABC.
The above graphs clearly demonstrate how the relationship between broadcast channels is changing and who is gaining share and who has significant share of the Total TV vs Broadcast TV landscape.
The data and insights will change depending on the target audiences as well as the Channel mix analysed. Different time bands i.e., prime vs off peak; may well provide a different outlook as well.
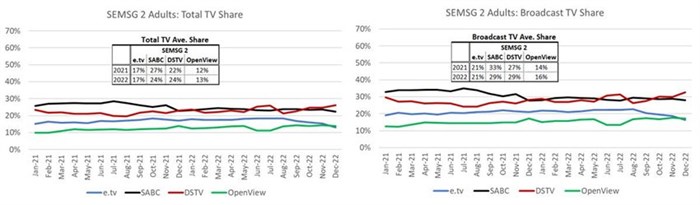
The three graphs below demonstrate how the picture changes against the 3 SEM Super Groups.
- SEM Super Group 1 on average in 2022:
- SABC commands 36% share of Broadcast TV. The share decreases to 29% against Total TV.
- SEM Super Group 2 on average in 2022:
- SABC & DStv are on a par at 29% respectively for Broadcast TV & 24% respectively to Total TV.
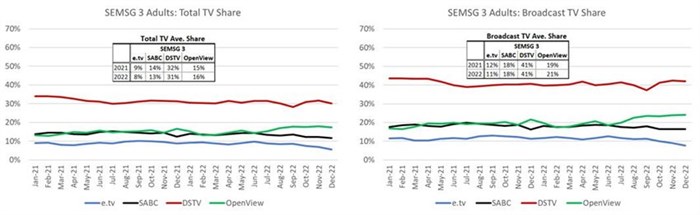
- SEM Super Group 3 on average in 2022:
- DStv holds 41% share of Broadcast and 31% of Total TV.
The above shows that no matter the economic sector, viewing all Content on a TV set, including viewing via streaming or other devices is increasing across all audiences which will ultimately impact on campaign performance as audience viewing becomes increasingly fragmented.
Understanding the dynamics and shifts between the three major competitor TV Groups, is also enlightening. Reflecting e.tv and OpenView as a combined commercial offering, clearly shows how the group has overtaken both SABC and DSTV.
Only at SEM Super 3 level does DStv overtake eMedia.
Analysing Total TV vs Broadcast TV share data, provides insight into the exponential growth in viewing content via steaming or other devices connected to the TV set and how it impacts TV stations groups share. Currently the TAMS data does not provide details on non-broadcast content and therefore this viewing cannot be included as part of campaign planning. A key objective for 2023 for the BRC is the TAMS measurement of alternative devices used in the home to view TV content which will facilitate wholistic viewing measurement.
Contributed by K. Phelan on behalf of The AMF Board
About the AMF
The Advertising Media Forum (AMF) is a collective of media agencies and individuals including media strategists, planners, buyers and consultants through whom 95% of all media expenditure in South Africa is bought. The AMF advises and represents relevant organisations and aims to create open channels of communication and encourage and support transparent policies, strategies and transactions within the industry.
For more information on the AMF, visit amf.org.za.
For comment on the industry issue covered in this editorial, please contact:
Koo Govender
AMF Chairperson
Cell: 083 272 0063
Email: moc.sigeaustned@rednevoG.ooK
OR
Karen Phelan
Board Member
Cell: 082 901 9467
Email: ten.asmoklet@nalehpk