Related
Top stories


More news


Marketing & Media
Ads are coming to AI. Does that really have to be such a bad thing?


Although the reality of job losses and economic pressure on consumers was anticipated, we struggled to see the evidence of this in our merchant spending and card issuing data. However, with time, the data starts building and we are able to look through the event driven spikes.
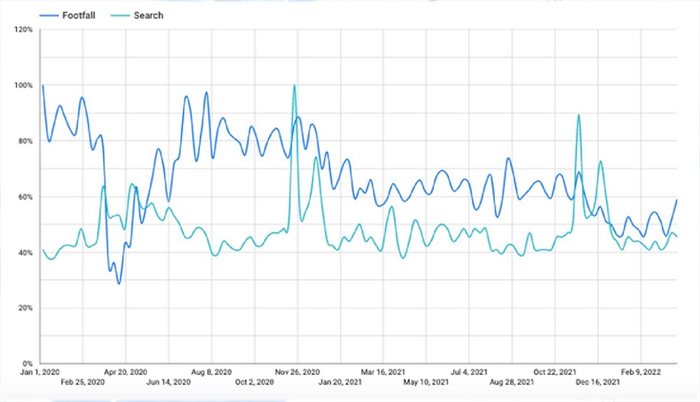
Looking at mobility data specifically, we can see a clear trend starting to emerge. It is evident from this data source that the overall retail footfall to malls has been on a downward trend for the past two years since January 2020, whilst online retail search has stabilised since the initial increase witnessed, albeit at a higher level than at the onset of the pandemic.
The data from our Merchant Spend Analytics up to March 2022 tells a story of a consumer that was holding firm, with increased spending in categories across the board since lockdowns eased. However, we recognise the gap in the data is the cash trading in the system, and that cash is more difficult to track, bearing in mind that South Africa has a large cash economy.
In our Absa Cash Collection business, we have however identified a similar trend to that witnessed in the mobility data, showing a decline in cash volumes processed, giving rise to a potential warning sign pertaining to the consumer’s financial health.
Furthermore, during the month of April we saw negative growth in our merchant spending data in some categories (including groceries), raising a further flag to our concern.
The data, although still very limited, could suggest that economic pressure on consumers is mounting. Further pressure in terms of the fuel price hikes and the cost pressure building in the supply chains as a result, certainly paints a bleak picture on consumer health and economic outlook for South Africa.
In summary, it seems the chicken has come home to roost. South Africa’s recovery from the impact of lockdowns looks like it might be a difficult one for the majority of consumers, especially because of the compounding effect of the interest rate hikes as well as the increasing fuel and energy prices.
The table below shows the total percentage change in spend per category. This is derived from our merchant spend data.
| YTD April | 2020-2021 | 2021-2022 | CAGR | Full Year (2020 - 2021) |
| Automotive | 43% | 9% | 25% | 23% |
| Building & Hardware | 61% | 0% | 27% | 20% |
| Clothing | 45% | 9% | 26% | 20% |
| Education | -17% | 33% | 5% | 5% |
| Electronic & Computers | 65% | 7% | 33% | 23% |
| Fast Food | 54% | 19% | 35% | 46% |
| Gambling | 13% | 33% | 23% | 39% |
| Games & Gaming | 644% | 109% | 294% | 432% |
| Garages | 16% | 13% | 14% | 26% |
| Grocery Stores and Supermarkets | 4% | 0% | 2% | 4% |
| Health & Beauty | 7% | -2% | 2% | 12% |
| Home & Garden | 70% | -5% | 27% | 21% |
| Nightclubs | 66% | 50% | 58% | 71% |
| Stationery & Office Furniture | 42% | 11% | 26% | 25% |
| Tourism | -17% | 78% | 22% | 39% |
| Transportation | -21% | 114% | 30% | -4% |
This graph shows the footfall trend for total retail vs total online retail. Total retail is defined as all retail categories combined for a market view.
