Why keeping your customers is now the smartest growth strategy
Cristelle Snyman


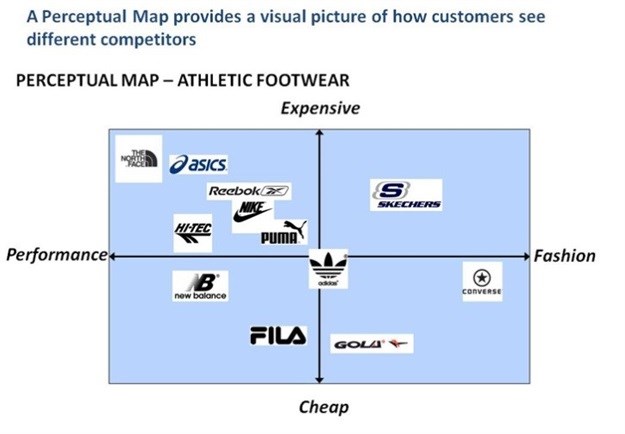
The research data on which such a perceptual map is based is mostly collected by asking respondents to associate brands with a list of attributes. Simply put: How do they perceive the brands in terms of having (or not) the attributes. Hence the term ’perceptual’.
Marketers, and their consultants, then make the assumption that when people choose between brands they first choose a segment that they want to buy from, and then they choose between the brands in that segment. This logic would lead one to conclude, in the example, that when people want a cheap-fashionable shoe they would choose between the two brands in the bottom right segment. This is not necessarily the case.
It makes a lot more sense to directly ask people between which brands they choose than asking them their perceptions of the brands. Research is always better when one asks direct and simple questions.
People’s choice will always be affected by the price of the brand. As in this example, expensive – cheap is nearly always one of the dimensions of a perceptual map. So, one should not only ask them which brand they would choose, but one should qualify this by specifying brand prices.
“There is no brand loyalty that a price-off cannot beat.” – Anonymous.Brand demand curves
Including this in any project, even one aimed at producing perceptual maps does not make questionnaires onerous. This produce brand demand curves rather than simply treating the respondent as a static point, i.e. someone that will choose the brand at all times, even irrespective of price.
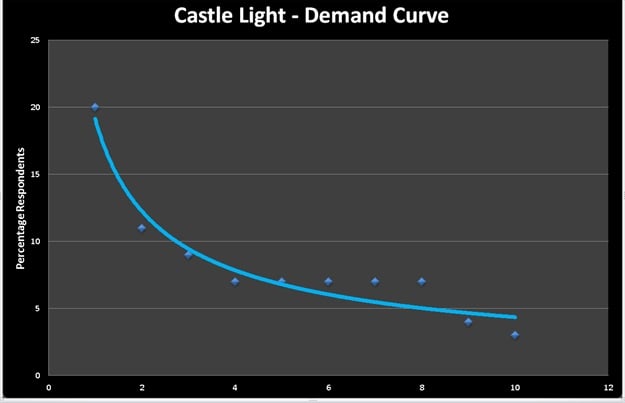
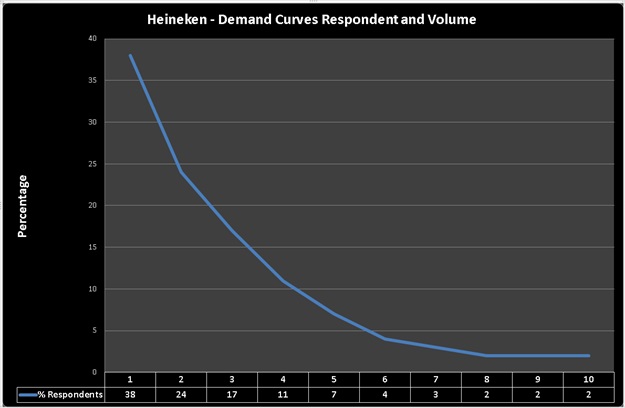
I did this with a small sample of beer drinkers and reproduced brand demand curves as in chart 2 and 3. I then produced a video on YouTube showing how the resultant segmentation of the beer market is different when one segments based on choice rather than perceptions: