Apps show revenue in the billions

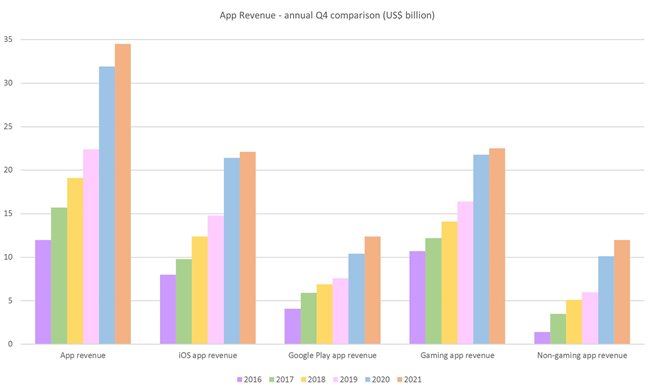
I extracted the data for the fourth quarter (Q4) for the last 6 years (2016 – 2021) and it’s all up, up, up.
Revenue is in $bn, and the billions keep climbing. The data covers all revenue (advertising, subscriptions, app purchases, etc.) in both the iOS and Android stores.
Total revenue climbed every Q4, but especially in 2020 (blue bar) and ended 2021 (orange bar) at $34.5bn – up from $12bn in Q4 of 2016. That’s just short of trebling in six years!
The split between the two stores in Q4 of 2021 was: iOS – $22.1bn and Google Play – $12.4bn.
The split between gaming and non-gaming in Q4 of 2021 was: gaming – $22.5bn and non-gaming - $12bn.
Where is it coming from?
Q4 of each year is up since 2016, but the big jump came in 2020. Perhaps apps scored off the tight lockdowns that year and the ‘locked up’ resorted to digital games to pass the time?
A big chunk of app revenue is coming from China – no guesses there, as that sky-rocket took off in 2016.
Next is America: it started its’ sprint in 2017 and is climbing fast. Japan and Europe are both on a much more sedate, but steady upwards trajectory at the bottom. The Rest of the World category rocketed out of the starting gate in 2019 and is closing in on America. Highest average revenue per user is South Korea and Japan.


