Top stories


More news


Marketing & Media
Ads are coming to AI. Does that really have to be such a bad thing?


Throughout your career, you’ve probably happened upon multiple measurement frameworks that include the infamous conversion funnel approach, Avinash Kaushik’s STDC framework, and even a simple KPI Excel document that has been mapped to define success.
If you’re already wondering about how you can better your measurement efforts, great! This is the first step in finding the right solution for your business, brand or client.
While the above are effective and accurate measurement techniques, they often prove complex and do not always translate well to a non-analytical mind. If you’ve attempted any of the above frameworks but have not gotten far then you should consider a different approach.
Often these are split into various teams both internally and externally, and they require quite a bit of collaboration.
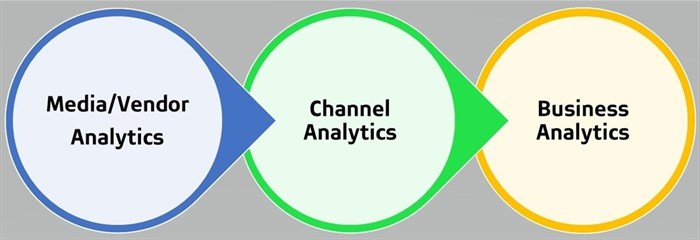
The first is media (also known as vendor analytics), which is normally covered by your media partners, agency and marketing team. The second is channel (also known as platform analytics) – which is primarily covered by marketing managers or digital owners within the business, but there are benefits to the media partners and agencies having full sight of this. The last is business, which is primarily covered by the client and business analytics teams.
These segments are often referred to as the source of truth, with each team viewing this from a different perspective.

Once you’ve defined who is responsible for these three segments, your next step is to drive collaboration in the ecosystem; this could be through the use of tools such as Google Data Studio or Tableau, or even a project manager with technical and analytical skills.
This project manager will need to work closely with partners, agencies, and the client. The grand job here is to assist in creating a single source of truth, with transparency across these segments of measurement.
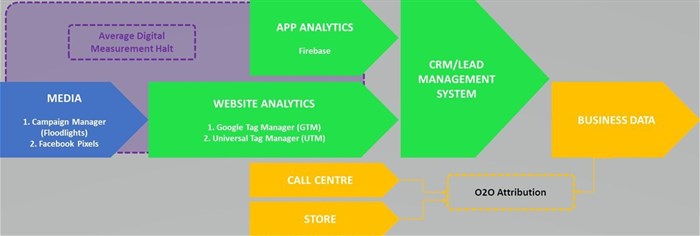
A great approach is to map this out as the customer journey through a waterfall diagram. Using a tool like Funnelytics or designing something on PowerPoint should make this a little easier for the visualisation of the segments.
In addition, including how these segments and ecosystems work with one another can give you further clarity on how measurement ties into everything.
Here’s an example:

As mentioned above, an easy way to create your single source of truth is by using a data aggregator such as Google Data Studio or Tableau. These tools pull in all performance data and aggregate the results in a single place; even better if you have the transparency to pull in CRM data.
Thanks go to Maurice Wilkes, David Wheeler and Stanley Gill who paved the road for the APIs we use today. These incredible plugins pull data into your chosen aggregators to tell a story of success or failure, and highlight where the possible gaps in your system are.
Using a measurement framework also allows you to begin cross referencing data points, such as using the media spend to account for specific events that triggered in your analytics (that were not being measured by media as a conversion), and generated X sales and drove X revenue.
Who said calculating a ROI was hard?
