Results of the sixth MSCI South Africa Green Annual Property Index has further bolstered the investment case for green buildings in the commercial property sector. The index showed that the investment performance of certified green, Prime, and A-grade offices improved in 2021 and outperformed non-certified assets of a similar quality by 170bps during the year.

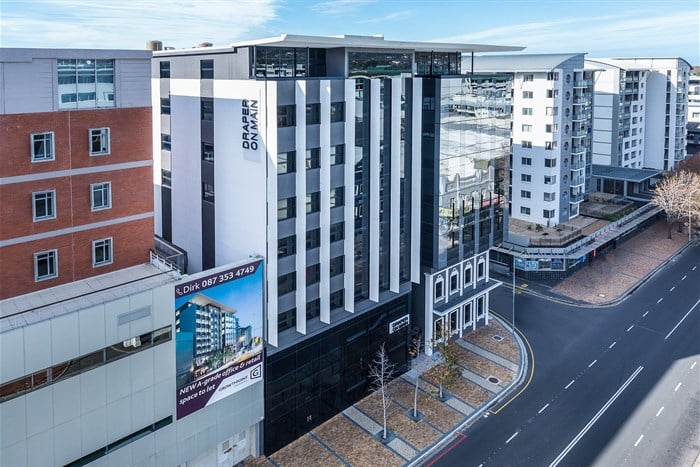
Green Star certified, Prime A-Grade offices at Draper on Main in Claremont, Cape Town
The MSCI SA Green Annual Property Index provides an independent and consistent comparative return on investment for green-certified and non-certified offices. Released annually in conjunction with the Green Building Council of South Africa (GBCSA) and sponsored by Growthpoint Properties, the index provides an independent, globally consistent view on the investment performance of green-certified and non-certified offices.
At the end of 2021, the index sample comprised 303 prime and A-grade office properties valued at R59.1bn, of which 153 were green-certified buildings. These were compared to 150 non-certified offices of a similar quality.
“Once again, the MSCI index results reflect the business case for green-rated buildings. Not only are these buildings more efficient, reducing the cost of occupancy for tenants, but they also provide a healthier environment for occupants, which is particularly relevant as staff return to their offices. The fact that green buildings achieve better returns shows that tenants are recognising these benefits,” says Paul Kollenberg, Growthpoint’s head of asset management: office.
Green offices outperformed by 19.1% since 2016
For the year ended December 2021, the green-certified office sample delivered a total return of 2.2%, 170bps above the non-certified sample’s return of 0.5%. This was a similar outperformance to that measured in 2020, and takes the cumulative total return of green-certified offices to 45.2% since the inception of the index six years ago. Over this period, green certified offices outperformed the non-certified sample by 19.1% - an annualised outperformance of 260bps.
A key reason behind the strong performance of green certified offices is its comparatively high income return despite a 29% higher capital value per square metre. This was achieved courtesy of a 30% higher net operating income (NOI) per square meter compared to non-certified office buildings, again reinforcing the importance blue chip occupiers are placing on green office accommodation.
“Since the first green star certified building in 2009, the Green Building Council of SA and those certifying their buildings, knew – almost instinctively – that it made business sense to certify green. We spoke then of the ‘rands and sense’ of green buildings, with a lot of the business savvy couched within the lower utility bills, healthier buildings and highly productive occupants. The last six years’ worth of the MSCI SA Green Property Index results has moved the conversation to that of NOI and capital value. The conversation is not only about bottom-line savings, but about investment – ‘rands and sense’ to value of green,” says GBCSA CEO, Lisa Reynolds.
Green office cashflows deemed lower risk
Green certified offices boasted significantly lower per square meter usage of electricity (-11.6%) and water (-20.7%) when compared to non-certified offices. With administered costs rising at rates in excess of inflation, these costs can have a significant impact on performance over the lifecycle of a property. As a result, the green-certified office sample had a 50bp lower discount rate when compared to the non-certified sample, implying that its future cashflows were deemed lower risk.
Green certified offices better across all measures
Released in April 2022, the MSCI South Africa Green Annual Property Index demonstrated the link between green-certified buildings and investment performance but also of its lower vacancy rate, lower operating cost, higher net operating income and lower discount rate.
“In an extremely tough office market, it is encouraging to see that green certified buildings continue to outperform non-certified buildings. Not just because the perceived risk in the income stream is lower but is also underpinned by better property fundamentals - vacancies are lower and margins are higher. Certification provides a proven tool for asset managers to leverage off, giving investors an enhanced return,” says Eileen Andrew, vice president: client coverage at MSCI South Africa.
Comparison of Green Star Certified Buildings vs Non-Certified Buildings in 2021
| Certified | Non-certified |
| Total Return (%) | 2.2 | 0.5 |
| Vacancy Rate (%) | 15.6 | 16.3 |
| Net Operating Income per square meter | 144 | 111 |
| Capital Value per square meter | 20,998 | 16,226 |
| Total Operating Cost % of Gross Income | 35.6 | 39.8 |
| Water Usage (m3 per annum) | 0.5 | 0.7 |
| Electricity Usage (kWh per annum) | 138 | 156 |


