
Top stories


More news


Marketing & Media
Ads are coming to AI. Does that really have to be such a bad thing?


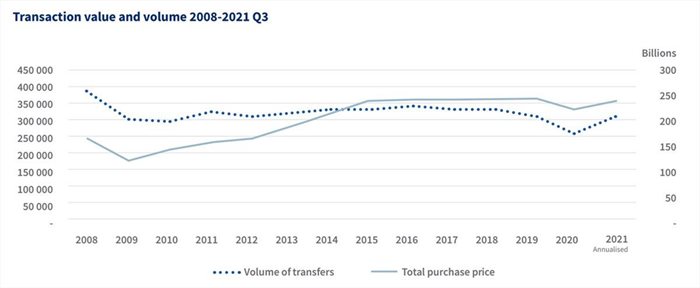
While transfer volumes dropped a record 16% in 2020, the market is not only returning to normal, but surpassing performance from previous years. Both property prices and transfer volumes remain consistent in South Africa; between 300,000 and 350,000 a year since 2009.
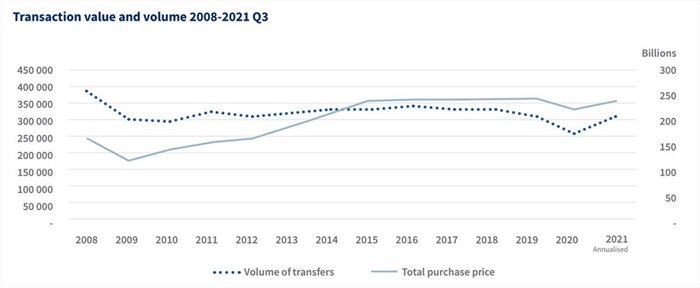
“A positive continuation of the increase in volumes would return the market to pre-2020 levels, pushing annualised transfer volumes to 308,000 at the close of the year,” says Hayley Ivins Downes, head of digital, Lightstone Property.
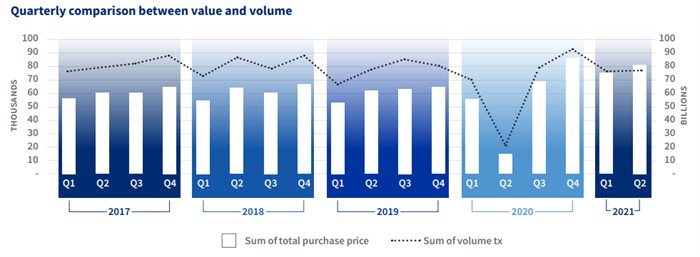
Q1 (2021) closed with volumes exceeding all prior years (up to 2018), much like Q4 (2020), which topped five years observed by 26.55% across the board. Volumes in Q2 (2021) closed, albeit unsurprisingly, 388.16% higher than Q2 (2020) volumes, though interestingly tracked lower than 2017, 2018, and 2019.
Before government’s response to Covid-19 in 2020, the total purchase value (graph below) per quarter was +R60bn and dropped to around R15bn (Q2-2020) when South Africa was in hard lockdown. Since then, it has recovered rapidly and now sits at between R75bn and R85bn per quarter.
Q2-2021 finished off at just under R80bn. The higher values and flatter volumes suggest that it’s the higher value properties that are transacting. This could also, however, indicate greater mobility in the higher wealth bands.
Properties in the R1m–R3m band have grown most significantly over the past 15 years, with the next strongest price bracket coming from the R3m+ band.
From 2008-2014 most transactions occurred in the R500k and below price band, although declining year on year. In 2015 houses in the R500k–R1m band became most dominant until three years later in 2018.
The R1m to R3m band took over as the top-selling category in 2018 and has fuelled the steep increase in the total purchase price.
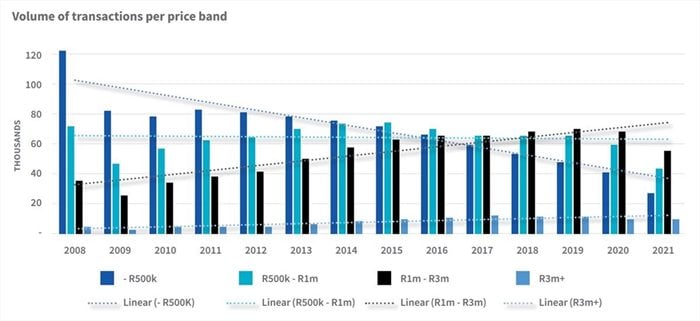
Ivins Downes says, “The decline of sales in the ‘less-than-R500k’ market reflects the financial turmoil many South African consumers are facing, exacerbated by the effects of the pandemic. While negative at face value, this creates a potential for lenders - if they can provide funding solutions to this segment of the market, especially when the economy eventually grows and employment levels rise.”

The average time it is taking to sell properties has increased to over five months during 2020, especially in the super luxury segment. Encouragingly though, the time properties stay on the market has dropped in 2021 to levels slightly lower on average than those experienced since 2018.
“While properties are spending less time on the market in 2021, especially in the lower segments, the list price to sales price is lower overall, especially in the lower price segments - bearing in mind that we don’t have a full view of transfers for 2021,” observes Ivins Downes.
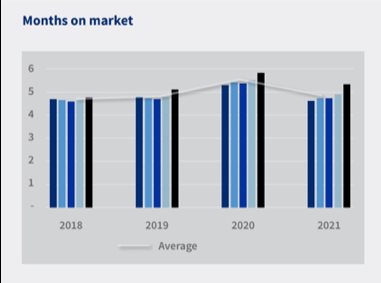
In the luxury segment, properties are currently staying on the market for longer with sellers settling for lower than listing prices compared to previous years. The high-value segment, however, has experienced a decrease in time on the market, and a higher percentage of sales are closer to the listing price when compared to other segments.
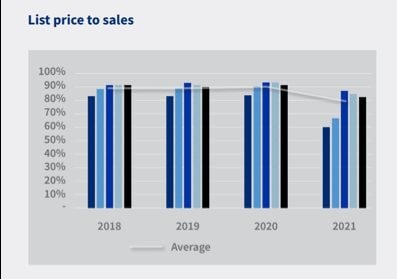
Sales inflation is most pronounced in the Luxury segment, which has recovered from its dip in late 2019 and early 2020. This could be a positive sign for the property market as historically, the luxury segment has led the market through its peaks and troughs.
“Using data from previous years, safe predictions can be made that the rest of the market will follow suit, promising a strong close to both Q3-2021 and Q4-2021,” concludes Ivins Downes.