Top stories

Marketing & MediaCould an alcohol ad encourage children to climb into washing machines?
Karabo Ledwaba 4 hours

Energy & Mining#MiningIndaba: Is South African mining ready for the skills of tomorrow?
Maroefah Smith 6 hours


More news


Figures fail to recover
The figures failed to recover in Q3 2012 after a sharp decline in Q2 2012. Following the deterioration from 58.9 points in Q1 2012 to 48.6 points in Q2 2012, the CFVI declined further to 47.9 points in Q3 2012. As Table 1 shows, the CFVI is now lower than in Q2 2009, which was the last quarter of the economic recession.
| Date | Savings | Expenditure | Debt servicing | Income | Overall CFVI |
|---|---|---|---|---|---|
| Q2 2009 | 42.6 | 44.6 | 56.3 | 43.6 | 48.4 |
| Q1 2012 | 58.8 | 60.1 | 56.6 | 57.6 | 58.9 |
| Q2 2012 | 47.5 | 53.8 | 47.8 | 44.8 | 48.6 |
| Q3 2012 | 42.1 | 54.4 | 48.1 | 46.8 | 47.9 |
This CFVI-reading means that consumers felt very exposed in terms of their cash flow as the risk increased for them to become financially vulnerable.
| Financially vulnerable | Financially exposed | Financially secure | |||
|---|---|---|---|---|---|
| 0 - 20 | 20 - 39.9 | 40 - 49.9 | 50 - 59.9 | 60 - 79.9 | 80 - 100 |
| Extremely vulnerable | Very vulnerable | Very exposed | Mildly exposed | Very secure | Extremely secure |
Table 1 shows that compared to Q2 2009, the biggest changes occurred in the expenditure and debt servicing categories:
The above changes are interrelated and can be explained by the CFV transmission path. In order for consumers to maintain their expenditure, which was driven higher by such things as sharp increasing utility and transport costs, they incurred debt. However, they are borrowing more expensively as they are granted unsecured loans, whose debt servicing costs are more than 2.2 times more expensive than that of the secured loans they obtained during Q2 2009.
The results of the Q3 2012 CFVI were obtained from the recent Finscope survey among consumers. This enabled more detailed CFV-analysis by income group, education level, employment status and age group.
The following inferences could by drawn from such analysis.

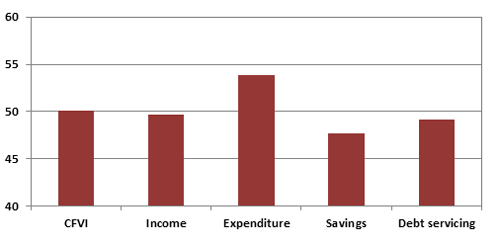
A CFV-profile of the income group within which most of the striking miners fall was constructed using various data sources such as obtained from the Finscope survey, All Media and Products Survey (AMPS) and the National Credit Regulator (NCR). Figure 3 shows that the income group earning between R60 000 to R150 000 per annum is generally financially exposed in terms of its cash flow and very exposed as to its income, ability to save and to service its debt.

The debt servicing fragility can to a large extent be explained by the change in the type of credit it has incurred. Table 2 shows that whereas 41.1% of new credit was secured in Q2 2009, it declined to 21.4% in Q2 2012. In contrast, the more expensive unsecured credit nearly doubled from 28.3% in Q2 2009 to 54.2% in Q2 2012. As the interest rate on unsecured credit exceeds that of unsecured credit by more than 2.2 times, the debt servicing vulnerability of this income group had to increase - failing an increase in income.
| 2009 Q2 | 2012 Q2 | |
| Mortgages | 10.00 | 5.30 |
| Secured | 41.12 | 21.42 |
| Credit facilities | 16.19 | 15.77 |
| Unsecured | 28.25 | 54.24 |
| Short term | 4.43 | 3.27 |
Although many mineworkers went on strike to force mine management to pay them much higher wages, it appears from their educational profile that they generally do not possess the high-level educational skills needed for the high wage increases they demand. From AMPS statistics, it seems that during 2011. about 85% of drill operators, 57% of general mineworkers and about 50% of stope supervisors only had some secondary school level education, or lower.
Prof Jonathan Jansen of the University of the Free State recently indicated that this is reflective of a worrying notion emerging in South Africa, namely that material prosperity can be achieved without an education. He indicated that the demand by striking mineworkers for a wage of R12 500 after tax is more than that received by a beginner teacher with a degree and teacher's diploma. The level at which the said low skilled workers were successful in the past in securing relatively high incomes given their relative absence of high-level skills, are apparent from available 2011 AMPS statistics, namely:
For more information, email Prof van Aardt at az.ca.asinu@jcdraav.