


Top stories


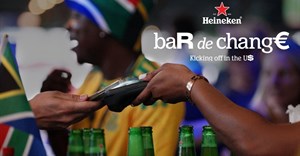
LifestyleHeineken helped South African fans beat World Cup beer prices with the return of Bar De Change
MSL Group 13 Jul 2026
More news


Marketing & Media
Nominations now open for the 2026 Kfm 94.5 Best of the Cape Awards – Powered by Yoco
Primedia Broadcasting 13 Jul 2026


ESG & Sustainability
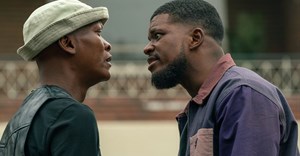
Racism at the World Cup is an ugly reality. How to understand where it comes from
Christian Ungruhe 15 hours

Lifestyle
We've been measuring football success wrong
SAB Corporate Fifa World Cup Campaign 13 Jul 2026


Tourism & Travel
Verified Impact launches free carbon accounting series for SA tourism sector
15 hours


Tourism & Travel
2026 Hospitality Think Tank shifts focus to AI, geopolitics and climate risks
19 hours
