Hot in the city: why investors should care about soaring temperatures

Our data stack covers a wide range of risk indicators. These include the fire weather index for wildfires, historical tropical storm incidence, lightning flash density, landslide risk, flooding, and more – at varying degrees of geographic detail, adding up to many billions of datapoints.
The number of recent heatwaves in Europe shows just how important being aware of these environmental risks is. Fine-grained weather data is an asset that Schroders has invested in for many years.
We have access to weather data across the planet at every 30km interval, with variables such as temperature and rainfall gathered each hour. This helps us to visualise the recent European heatwaves for some of the top cities in that region. Our environmental data helps us analyse the historical context of the heat and understand how unusual recent events were.
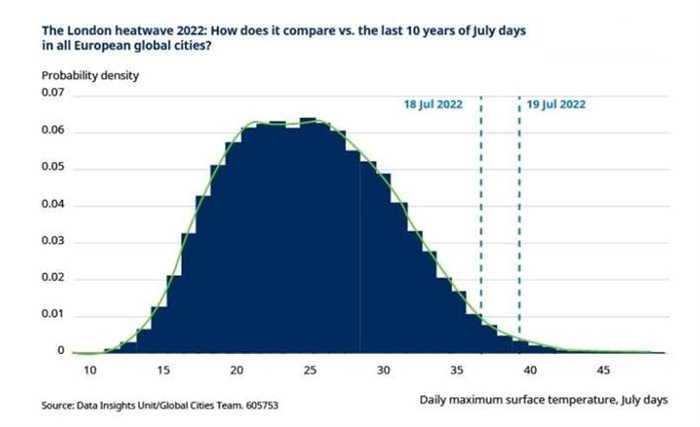
To put this extreme event in context, we can plot all the July days experienced in all the European global cities over the last 10 years on one histogram, and then pick out the recent London heatwave from the distribution. The approximately 36.5°C recorded in London on 18 July 2022 was hotter than 98% of all July days in European global cities over the last 10 years, and 19 July, at around 39°C, was hotter than 99%.

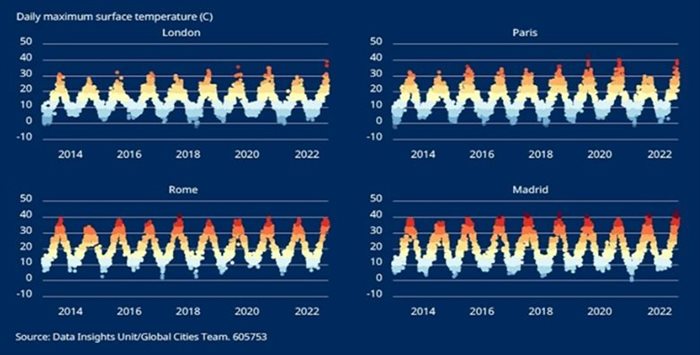
However, as the figure below illustrates, although a surface temperature of around 40°C is very unusual for London, some European cities regularly experience these kind of peaks. We have picked out Paris, Rome and Madrid for comparison. These cities make up most of the right-hand tail of the previous distribution, to the right of the red dotted lines:

The importance of the apparent temperature
Despite these short-term changes for London and Paris, we are more concerned about the effects of climate change on prevailing temperatures in South Asia. Although the figure most often reported in the media is the air temperature just above the Earth’s surface (plotted in the chart above – and labelled as ‘surface temperature’), what people perceive to be the temperature is more important for comfort.
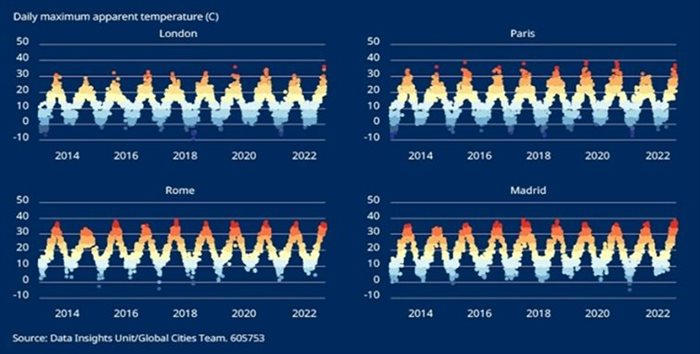
The ‘apparent temperature’ is the temperature equivalent perceived by humans, caused by the combined effects of air temperature, relative humidity and wind speed.
When we look at this measure for European cities compared to South Asian cities, it is clear that Europe still has a long way to go before its cities become as uncomfortable as those in South Asia.

Indeed, the impact of humidity and wind speed made it feel cooler than the approximately 39°C that was registered as the surface temperature on the 19 July 2022 in London. By contrast, in Delhi it regularly feels a full 10 degrees hotter than the actual temperature.

As the effects of climate change become more apparent across urban environments from South Asia to central and northern Europe, our infrastructure, offices and social spaces are going to come under increasing pressure to adapt.
Air conditioning may be the short-term knee-jerk response to keep clients happy; offices that lack this will fast become second-rate properties. However, the proliferation of air conditioning will further add to the operating carbon footprint of these spaces.
Over the medium term, we would expect to see buildings make use of innovative new architectural practices to reflect more light, minimise heat capture, and improve air circulation and ventilation. Urban planning that is conscious of the need to reduce urban “heat islands” will also need to become the norm, encouraging the provision and integration of green spaces into city centre developments.


