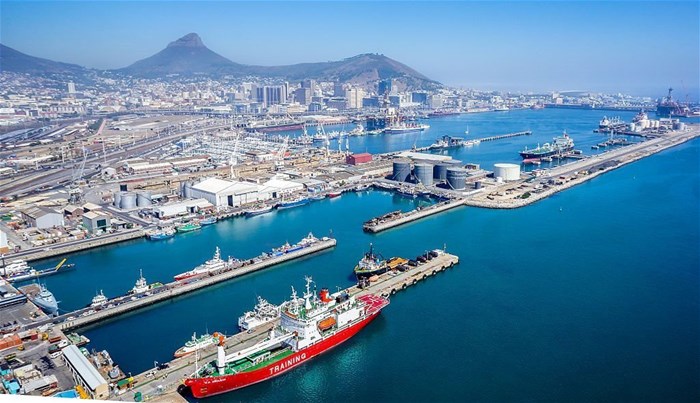
In a bid to enhance operational efficiency and competitiveness, Minister of Finance and Economic Opportunities, Mireille Wenger, joined together with officials from the Department of Economic Development and Tourism (DEDAT) and prominent stakeholders in the port logistics value chain, including Transnet National Ports Authority and Transnet Port Terminals, to unveil a new online data dashboard that was co-funded by DEDAT.
The dashboard gives access to live data relating to marine, waterside and landside operations at the Port of Cape Town.
Minister Wenger says: "This dashboard, which measures key indicators such as truck and vessel turnaround times, vessel time at anchorage and at berth, the average size of vessels calling, the time truckers spend in and around the Cape Town Container Terminal area, as well as key data on how weather conditions influence operations, will take us closer towards our collective goal of improving the performance of the Port of Cape Town."
This dashboard is an important step towards improving performance at the port by embracing technology, artificial intelligence, and predictive analytics technologies to model the optimal supply and demand for infrastructure. This will make planning, implementation, and management visible in real time. It will enable stakeholders to better plan and coordinate, which is a key requirement for efficient functioning at the port.
"We are all working towards realising the high-growth scenario in which the Port of Cape Town is able to facilitate an additional R6bn in exports, creating an extra 20,000 direct and indirect jobs. This could add 0.7% to the Western Cape GDP by 2026," continues Minister Wenger.
End-to-end visibility in logistics chains
As a first step, primary port users will be given access to the dashboard and invited to provide feedback to improve the effectiveness and the scope, so that it covers all relevant indicators in the logistics chain.
Minister Wenger concludes: "Our ultimate objective is to create end-to-end visibility of cargo in our logistics chains so that we can identify and evaluate the possibility of developing appropriate infrastructure to stimulate trade and exports. This will accelerate economic growth and create many more jobs in the Western Cape."


