Global ad spend on the rise

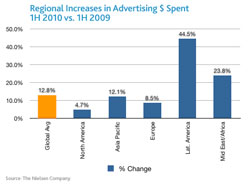
Global ad spend continues its steady climb to recovery with a 12.8% rebound in first half of 2010.
- Double-digit percentage ad increases for automotive, financial services, durables, and telecom;
- Healthy growth for Radio and Newspapers, though TV remains King;
- FMCG global spend surges - topping global ad spend share and highest growth increase
Ad spend increased in 35 out of 37 countries covered by the Nielsen Global AdView Pulse, an in-depth study on global advertising trends, with 26 countries posting double digit percentage growth. Only recession-battered markets of the UAE (-5.8%) and Ireland (-3.2%) recorded negative ad spend in the first half of this year.**
"The latest Q2 numbers reflect similar growth trends that emerged in Q1 this year," said Michele Strazzera, deputy managing director of Nielsen Global AdView. "According to rate-card figures, the global advertising industry continued to improve in Q2 with positive growth in all regions and across all media, led notably by the Asia Pacific market."
While numbers showed a slower path towards recovery for North America and Europe, the trend is still positive with a return to discretionary ad categories such as automotive and durables. "Discretionary ad spend categories recorded the highest year-on-year increases, which is a leading indicator that advertisers and consumers are more confident to spend again," said Strazzera.
Automotive sector sees biggest increase
The automotive sector in North America (17.3%) saw the biggest year-on-year increase in ad spend in the first half of this year, while Clothing/Accessories in Europe (14.9%) rebounded the strongest, and durables in the Asia Pacific (29.7%) enjoyed the biggest increase. Financial services in Latin America (73.9%) had the biggest year-on-year increase, while telecommunications in Middle East/Africa (38.7%) recorded the strongest rebound.
On a quarterly basis, Q2 ad spend was also up 12.9% compared to the same period last year. However, Nielsen numbers showed that the pace of growth slowed slightly in Asia Pacific and Latin America compared with the first quarter. "The slower growth in Asia Pacific is not a cause for concern; as Asia Pacific performed better than the majority of regions in Q2 2009, we see a slower pace when comparing them against regions that made a later recovery. However, the Asia Pacific region as a whole is still a strong performer as evidenced by the data," explained Strazzera.
The biggest surges
In the first half of 2010, Latin America (44.5%) and Middle East/Africa (23.8%) recorded the biggest surges year-on-year with highest per country increases from Egypt (36.4%), Brazil (50.2%), and Mexico (+40%).
North America and Europe, which both hold 23% of the global market, posted modest to healthy gains.
Europe posted an 8% ad spend increase for the first six months of 2010, led by double-digit increases in major regional markets of UK (10.7%), Germany (9.6%), and France (11.6%). The weakest ad markets in Europe were Ireland (-3%) and Spain, which remained flat.
Asia Pacific, the world's most lucrative ad spend region with 38% of global ad spend share, enjoyed robust growth in the first six months of this year, with the majority of Asian markets posting double-digit growth compared to first half of 2009.
In the Pacific, ad spend in Australia and New Zealand rose 8% and 9% respectively. Advertising in Japan, the world's third largest economy, remained flat but avoided further decline. India topped the region's ad spend with 32% year-on-year increase mainly driven by the durables and FMCG sectors, followed by Hong Kong (23%), and Indonesia and Malaysia (22%).
TV tops
In every region, television (15.8%) remained the overwhelming ad medium of preference in the first half of 2010 with a 62% share of total global ad spend, an increase of 1% year-on-year. Radio also enjoyed healthy growth globally of 11% - although recorded a 1% decline in North America. Newspapers also gained a 9.5% increase in ad revenue in the first half of 2010 while magazines reported the slowest growth at 3.7% and was still in decline (-2%) in North America.
95 cents in every US$10 spent on advertising came from the healthcare sector - although this leading category went into slight decline from January to June this year as a result of decreased advertising in the Asia Pacific and North America. 89 cents in every 10 ad dollars in the first half of 2010 was spent by cosmetics & toiletries, the second largest advertising sector.
*at rate card values
** Methodology
The external data sources for the other countries included in the report are:
Argentina: IBOPE
Brazil: IBOPE
Egypt: PARC (Pan Arab Research Centre)
France: Yacast
Hong Kong: admanGo
Japan: Nihon Daily Tsushinsha
Kuwait: PARC (Pan Arab Research Centre)
Lebanon: PARC (Pan Arab Research Centre)
Mexico: IBOPE
Pan-Arab Media: PARC (Pan Arab Research Centre)
Saudi Arabia: PARC (Pan Arab Research Centre)
Spain: Arce Media
UAE: PARC (Pan Arab Research Centre)
Source: The Nielsen Company
The Nielsen Company is a global information and media company with leading market positions in marketing and consumer information, television and other media measurement, online intelligence, mobile measurement, trade shows and business publications. For more information, go to www.nielsen.com.
Go to: http://www.nielsen.com


