Top 10 video content properties by unique viewers
Google Sites, driven primarily by video viewing at YouTube.com, ranked as the top online video content property in November with 151.6 million unique viewers, while VEVO ranked second with 55.4 million. Facebook.com ranked third with 50.8 million viewers, followed by Yahoo! Sites with 50.4 million and Viacom Digital with 47.4 million. More than 40 billion videos views occurred during the month, with Google Sites generating the highest number at 20.5 billion.
The average viewer watched 20.5 hours of online video content, with Google Sites (7.4 hours) and Hulu (3.3 hours) demonstrating the highest engagement among the top ten properties.
| Top US Online Video Content Properties Ranked by Unique Video Viewers November 2011 Total US - Home/Work/University Locations Content Videos Only (Ad Videos Not Included) (Source: comScore Video Metrix) | | Property | Total Unique Viewers (000) | Videos (000)* | Minutes per Viewer |
| Total Internet : Total Audience | 183,160 | 40,890,925 | 1,229.2 |
| Google Sites | 151,563 | 20,463,820 | 444.5 |
| VEVO | 55,381 | 871,672 | 71.3 |
| Facebook.com | 50,797 | 268,148 | 19.1 |
| Yahoo! Sites | 50,397 | 518,848 | 50.7 |
| Viacom Digital | 47,431 | 514,469 | 56.2 |
| Microsoft Sites | 44,715 | 588,691 | 43.8 |
| AOL, Inc. | 43,399 | 468,959 | 52.7 |
| Hulu | 31,347 | 1,048,094 | 199.3 |
| NBC Universal | 29,105 | 106,914 | 18.3 |
| Turner Digital | 27,816 | 200,696 | 30.1 |
*A video is defined as any streamed segment of audiovisual content, (both progressive downloads and live streams). For long-form, segmented content, (e.g. television episodes with ad pods in the middle) each segment of the content is counted as a distinct video stream.
Top 10 video ad properties by video ads viewed
Americans viewed 7.2 billion video ads in November, with Hulu generating the highest number of video ad impressions at more than 1.3 billion, followed by Tremor Video in second with 1.1 billion. Adap.tv crossed the 1 billion mark for the first time earning the #3 spot, followed by BrightRoll Video Network with 722 million and Specific Media with 513 million. Time spent watching video ads totalled more than 3 billion minutes during the month, with Tremor Video delivering the highest duration of video ads at 594 million minutes. Video ads reached 53% of the total US population an average of 45 times during the month. Hulu delivered the highest frequency of video ads to its viewers with an average of 44.
| Top US Online Video Ad Properties Ranked by Video Ads* Viewed November 2011 Total US - Home/Work/University Locations Ad Videos Only (Content Videos Not Included) (Source: comScore Video Metrix) | | Property | Video Ads (000) | Total Ad Minutes (MM) | Frequency (Ads per Viewer) | % Reach Total US Population |
| Total Internet : Total Audience | 7,213,918 | 3,080 | 45.4 | 52.4 |
| Hulu | 1,320,504 | 565 | 44.4 | 9.8 |
| Tremor Video** | 1,076,607 | 594 | 16.7 | 21.2 |
| Adap.tv† | 1,004,273 | 551 | 12.6 | 26.3 |
| BrightRoll Video Network** | 721,863 | 449 | 8.0 | 29.8 |
| Specific Media** | 512,882 | 247 | 6.1 | 27.8 |
| CBS Interactive | 395,760 | 163 | 16.3 | 8.0 |
| TubeMogul Video Ad Platform** | 360,191 | 177 | 6.6 | 18.1 |
| Microsoft Sites | 350,353 | 136 | 8.7 | 13.3 |
| AOL, Inc. | 346,828 | 208 | 7.9 | 14.5 |
| SpotXchange Video Ad Marketplace** | 296,814 | 170 | 10.0 | 9.8 |
Note: In November 2011 Video Metrix data, TIDAL.TV (now known as Videology) was inadvertently omitted from the data due to a processing error. This issue will be corrected with December 2011 data and the entity will be reported under its new name, Videology.
*Video ads include streaming-video advertising only and do not include other types of video monetisation, such as overlays, branded players, matching banner ads, homepage ads, etc.
**Indicates video ad network
†Indicates video ad exchange
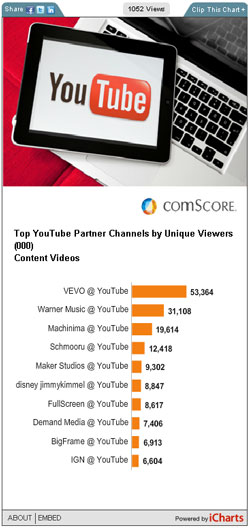
Top 10 YouTube partner channels by unique viewers
The November 2011 YouTube partner data revealed that video music channels VEVO (53.4 million viewers) and Warner Music (31.1 million viewers) maintained the top two positions. Gaming channel Machinima ranked third with 19.6 million viewers, followed by Schmooru with 12.4 million, Maker Studios with 9.3 million and disney jimmykimmel with 8.8 million. Among the top 10 YouTube partners, VEVO demonstrated the highest engagement (71.1 minutes per viewer) and highest number of videos viewed (845 million), while Machinima exhibited the second highest engagement (68.5 minutes per viewer) and number of videos viewed (327 million).
| Top YouTube Partner Channels* Ranked by Unique Video Viewers November 2011 Total US - Home/Work/University Locations Content Videos Only (Ad Videos Not Included) (Source: comScore Video Metrix) | | Property | Total Unique Viewers (000) | Videos (000) | Minutes per Viewer |
| VEVO @ YouTube | 53,364 | 845,459 | 71.1 |
| Warner Music @ YouTube | 31,108 | 211,341 | 29.0 |
| Machinima @ YouTube | 19,614 | 327,121 | 68.5 |
| Schmooru @ YouTube | 12,418 | 68,718 | 22.7 |
| Maker Studios @ YouTube | 9,302 | 77,595 | 31.8 |
| disney jimmykimmel @ YouTube | 8,847 | 15,807 | 9.1 |
| FullScreen @ YouTube | 8,617 | 36,099 | 16.7 |
| Demand Media @ YouTube | 7,406 | 20,318 | 9.6 |
| BigFrame @ YouTube | 6,913 | 32,511 | 17.9 |
| IGN @ YouTube | 6,604 | 27,938 | 18.4 |
*YouTube Partner Reporting based on online video content viewing and does not include claimed user-generated content.
YouTube Nov 2011 2The November 2011 YouTube partner data revealed that video music channels VEVO (53.4 million viewers) and Warner Music (31.1 million viewers) maintained the top two positions. Gaming channel Machinima ranked third with 19.6 million viewers, followed by Schmooru with 12.4 million, Maker Studios with 9.3 million and disney jimmykimmel with 8.8 million. Among the top 10 YouTube partners, VEVO demonstrated the highest engagement (71.1 minutes per viewer) and highest number of videos viewed (845 million), while Machinima exhibited the second highest engagement (68.5 minutes per viewer) and number of videos viewed (327 million).
This social chart is intended for public use. Click here to see how to include it in an online article.
Other notable findings from November 2011 include:
- 85.9% of the US Internet audience viewed online video.
- The duration of the average online content video was 5.5 minutes, while the average online video ad was 0.4 minutes.
- Video ads accounted for 15.0% of all videos viewed and 1.3% of all minutes spent viewing video online.