According to a recently released study from Lightstone and Tracker, traffic levels fell dramatically by more than 60% in Gauteng and the Western Cape when hard lockdown was enforced in April, but traffic levels from certain areas to commercial nodes fell by between 10-15% less than traffic in more affluent areas.
The study analysed aggregated and anonymised data from a significant portion of Tracker’s more than 1.2 million subscriptions across South Africa to assess the effect lockdown has had on traffic. “The dataset provided an extensive view of vehicle stops within designated suburbs in the three provinces from February to November this year,” says Linda Reid of Lightstone.
Traffic levels in Kwazulu-Natal fell by around 53% in April – less than Gauteng and the Western Cape during the same time – and also recovered more quickly in May, climbing to 83% of the February benchmark compared to Gauteng (74%) and Western Cape (63%). By October, (see graph below) all three provinces were ahead of the February benchmark.
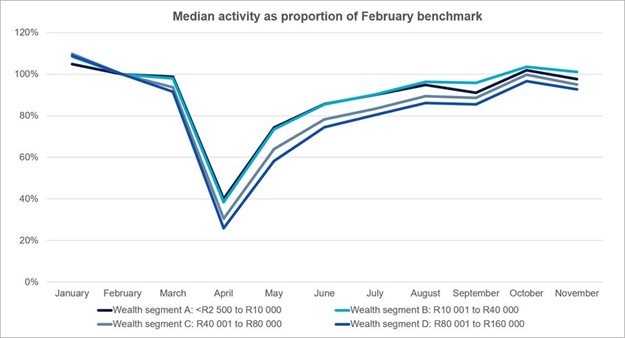
Analysis of the traffic patterns confirmed that people from less affluent areas who were less likely to have the ability to work remotely, continued to travel more than the other wealth segments throughout lockdown levels. Travel from wealth segments A and B reduced by around 60% in April, compared to nearly 75% recorded in the wealthy suburbs, and then recovered more quickly to surpass the benchmark by October.
The traffic heat maps demonstrate the fall in traffic levels in April, the rapid recovery in May and then the almost back-to-normal patterns in November.
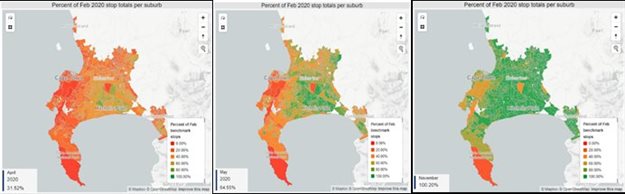
In the Western Cape, traffic levels reduced to just over 30% of the February benchmark. In the southern suburbs, traffic levels fell to below 20%, while patterns remained higher in the Cape Flats, and in some areas not dropping at all. By May, the Cape Flats was close to normal while the November heat map shows close to normal activity across the Western Cape, except for the CBD and the nature reserve at Cape Point.
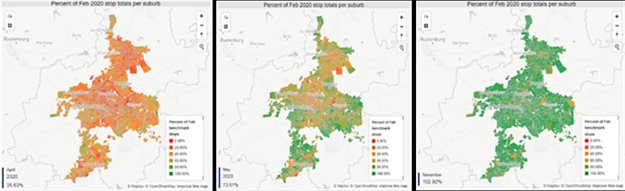
Gauteng has almost fully recovered, with only pockets where traffic levels are below the February benchmark.
In KZN, the effect of the air travel ban is most evident in the area around King Shaka Airport, still trailing traffic levels elsewhere which have returned to pre-February levels.
With new restriction levels being affected in holiday destinations like Kwazulu-Natal, the Garden Route and the Sarah Baartman district, some South Africans may now abandon their holiday plans and remain home for the holidays, which will more than likely change historical traffic patterns for this period.