Subscribe & Follow
Advertise your job vacancies
Trending


Jobs
- Urban Futures Graduate Remote

A new measurement paradigm that is ideal for ad testing
23 Jun 2017
One of the difficulties of advertising research is to determine the dimensions to measure.
In our last article, ‘Bringing precision and elaboration into ad testing’ we reported on our investigations into the literature and concluded that 'liking' can be measured by measuring six factors across all advertising.

This article deals with the measurement methodology that delivers the numbers. For example, one could use 5- (usually extremely important to extremely unimportant), 7- or 11-point rating scales (properly called Thurstone scales), one could use constant sum, which involves elements of trade-off (for example, the respondent is required to allocate 100 points spread across the 6 factors and all the points have to be used. These can be taken to represent the percentage importance of each of the factors).
There are many other ways that these measures can be obtained, like dragging and dropping or slider scales. But there are two important weaknesses to any and all of these. Firstly, they are not grounded in theory and don’t give clear meaning to the numbers that emerge. Is an ‘extremely important’ four times the distance from an ‘extremely unimportant’ rating? And is it the same distance for all factors? Secondly, they require cognition. The mind has to consider each factor according to a fixed scale – so a person may feel that the object is important sometimes and unimportant at other times, but has to make a judgement call.

Petro Kuprynenko © – 123RF.com
In the 1980s, a young mathematician working for the US Department of Defence was charged with creating a calculus to support decision making to be used in the SALT (Strategic Armaments Limitation Treaty) negotiations.
It is a very practical, accurate and innovative method. How it works is as follows…
Set the parameters: You have a number of items (ideas, statements, objects, options) that don’t have to be the same. The task is to measure each of these relative to each other according to a common property. This property could be importance, weight, difficulty, money or value. For example, consider a chair, a sofa and a book at different distances from a light source. The task is to measure how bright (how well lit) they are (this choice will become apparent shortly, but it could also be weight, ease of movement, or a wide variety of other criteria).
Compare all possible pairs: Binary comparison is the easiest way for the human brain to make a choice. It can be totally non-cognitive – is one thing lighter or darker, colder, taller, more interesting than the alternative? In the advertising context we would ask: “In relation to the factor ‘relevant and useful information’, which of two alternatives better provides that?” There’s a very important point that we will return to later: The fact that we compare ALL possible binary choices. A second point that arises from the parameters is that we can, theoretically compare a storyboard to a competitor brand’s finished commercial. In fact, we have done this a number of times and with excellent results.
Apply a scale: How much lighter or darker, colder, taller, more interesting, etc, is the one than the alternative? Thomas Saaty used an 11-point scale from ‘Exactly the same’ to ‘Completely different’. In our work on advertising 17 years ago, we tested the use of a scale ‘How easy was it to decide’ from ‘Obvious, no thought’ to ‘Couldn’t make up my mind’. Our latest work has further convinced us that it is a universal, affective metric that requires the least possible cognition and we’re working further on biometric and neuroscience scales.
Taken together, in the advertising testing context we would ask, in relation to the factor ‘relevant and useful information’, which of two alternatives better provides relevant and useful information and, having made that decision, follow with ‘how easy was it to decide?’
This gives us the following measures:
- From the comparison of each factor against every other factor, the importance of each of the factors to that person in making decisions in the category (X, Y & Z below).
- For each of the factors, the extent to which each advertising execution delivers that factor compared to any other execution (a1 b1 where they sum to 100, a2 b2 where they sum to 100, etc).
- The weighted score for each advertisement (sum to 100) (A, B).
This would be presented in a table as follows:
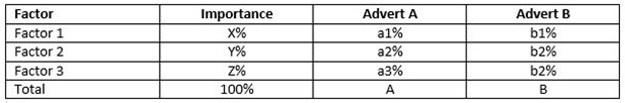
From this table one learns which is the best ad and why, as well as how it can be improved.
Coming back to the example of the chair, sofa and book and how ‘bright’ they appear to be. When his students were asked how well they were lit in each of the possible three comparisons, and how much brighter each appeared to be, and the calculations were done, the brightness of each was exactly in the ratio that the laws of physics would predict in that: brightness=(distance from the light source)3.
This element of internal and external validity extends further. Recall earlier we stressed that ALL possible paired comparisons were assessed. If we have three items, A, B and C, and if a person says A is better than B, and then says B is better than C – we could conclude that A is therefore better than C. That conclusion would be based on the assumption that the person was rational and logical. But since we did collect the comparison between A and C, we have a test of the assumption.
This is a profoundly important point. Prof Saaty’s methodology provides us with a way of assessing the consistency of judgements of each and every person. Moreover, it can be done while the questionnaire is being administered and can be used to route the respondent to diagnostic questions, or questions that may relate to patterns of expenditure that need to be correct to be used for modelling.
Put in colloquial terms, we only report on data that is given to us by people that we know tell the truth!
This aspect of Ad-Audit will be dealt with in more detail in the next article, which will examine respondents’ reactions, and what we have learned about people’s behaviour. For more information, please contact me at PSA on 083 255 2668 or click here to send an email.

About mike broom
I have been involved in marketing research for over 40 years, across all spheres. I started Marketing Science in 1992, Infosense (aka Infotools) in 1995 and Panel Services Africa in 2005. For more information on Ad-Audit, please contact me at infoQuest (formerly PSA) on 083 255 2668 or click here to send an email.
Related


2 critical challenges the market research industry needs to overcome when using AI
Dr Nikolai Reynolds 12 Jun 2024


The end of third-party cookies: How marketers can adapt and thrive
Daniele Joubert 20 Feb 2024