Over the last few years we have seen investors across the world face the same dilemma regarding the global market. We wait in anticipation for some certainty to return to the markets, for the seemingly unrealistic surging market rally to end and for a sense of normality to return. Ever since the atomic bomb of the 2008 financial crisis hit, individual investors and global market economies as a whole, have been trying to reconstruct their financial lives again - but just like the after effects of an atomic bomb that seem to linger for decades, the after effects and consequences of piecemeal attempts to pull ourselves back continue to haunt us.
For the last four years we have been witness to classic investor behaviour. Some savvy investors have managed to take advantage of the "accumulation" or trough phase in the market cycle, buying in when markets crashed and managing to acquire quality shares at discount prices. For many, the initial resurgence after the 2008 crash was looked upon with mistrust and an understandably healthy amount of fear. In general, most investors remained cautious, waiting for the next "bubble" to pop.
Although market cycles are, theoretically, easy to identify, in reality it is extremely difficult to identify accurately exactly where we are in the cycle. For the most part, emotions tend to get the better of the general investor - either stopping him from investing, or causing him to jump in greedily. The problem that most of us face is that we hold back too long and, when we jump in, the market is either beginning to normalise or is turning toward an upward swing in the cycle. As the tide turns, market conditions stabilise and remain so for a while. Market sentiment shifts from negative to more neutral territory. At this point, you will see early investors start foraying into the market - their confidence boosted by improved technicals.
As commodity prices slowly start to creep up and overall equity prices start to rise, the early phase of the bull market begins. As the rally gets well underway, investors who were previously burned when markets fell, quickly forget and, driven by greed and the fear of missing out, plough into the market. We see equities start to outperform and valuations rise well above historical averages. Sound judgement and reason are forgotten as greed takes over. At this point we see smart investors start to sell out and slowly we see equity prices start to moderate. Certain investors who are looking to time the market may see this as an opportunity to buy and, as they delve into the market, it causes the market to make one last jump, technically known as a selling climax.
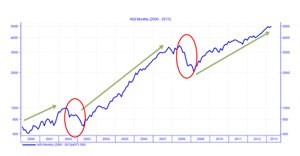
If we look at our equity market over the last decade, we will note that since 2000 the All Share Index has made gains in every year, except 2002 and 2008 when the financial crisis hit. In 2001 the market rose 40% and then crashed spectacularly in 2002 due to the "dot.com" bubble. It recovered in the year after and, between 2003 and 2007, produced an average 30%. The South African equity market was down about 30% in 2008, but up about 40% in 2009. Since that time investors have been waiting for the penny to drop, patiently waiting for markets to re-rate and for a correction to occur. In 2010 markets returned a respectable 19%, but relative to 2009 this was still much lower, adding to the uncertainty felt by investors. The relatively dismal performance from the equity markets in 2011 (2.6%) caused many investors to feel justified that the doom and gloom predicted had finally come to pass. Then, during the course of last year, equity markets surprised on the upside, rising to all-time highs in December and ended the year gaining 27%.
Being able to identify which phase of the market cycle we are in and in what way we can best take advantage of it would be tantamount to holding a crystal ball. No person can accurately and with 100% certainty do this. With the exception of a few investors, since 2008, the majority of the market has been caught between fear and hope - being equally swayed by positive and negative economic and industry information.
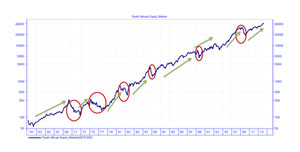
Dominated by a general level of uncertainty and a prevailing sense that the tide is soon going to turn, it is surprising to see the picture that emerges when we look at the South African equity market from a historical perspective. The graph below depicts the South African market from 1961 to 2013. The South African economy has over the last six decades experienced various ups and downs from both a political, socio-economic and growth perspective.
The oil crisis in the 1970s, the distorted government policies in the 1980s, the Asian crisis in the late-1990s, the blow up of the dot.com bubble in 2000 and, most recently, the global financial crisis of 2008, have all impacted on our economy. Looking at it on a monthly basis, what is evident is that although the market and economy were hit hard by these events, the duration of downward trends is significantly less than the upswings or market rallies that follow.
| Period | Upward/Downward Trend | Months |
|---|---|---|
| Mar-60 to Apr-69 | Upward Trend | 110 |
| May-69 to Nov71 | Downward Trend | 31 |
| Dec 71 to Oct-73 | Upward Trend | 23 |
| Nov 73 to May 77 | Downward Trend | 43 |
| Jun 77 - Oct 80 | Upward Trend | 41 |
| Nov 80 - Jun 82 | Downward Trend | 20 |
| Jul 82 Sep 87 | Upward Trend | 63 |
| Oct 87 to Aug 88 | Downward Trend | 11 |
| Sep 88 to Apr 98 | Upward Trend | 116 |
| May 98 to Dec 98 | Downward Trend | 8 |
| Jan 99 to May 02 | Upward Trend | 41 |
| Jun 02 to Nov 03 | Downward Trend | 18 |
| Dec 03 to Oct 07 | Upward Trend | 47 |
| Nov 07 to Feb 09 | Downward Trend | 16 |
| Marc 09 to Jan 13 | Upward Trend | 47 |
From an economic point of view there are a few clear indicators that may point to which phase in the cycle we may be. In the trough phase we would normally see a surge in unemployment, central banks will normally reduce interest rates as inflation tends to recede and consumers are under pressure. There is often also a general feeling of pessimism and negativity regarding the economy and market. Usually at this stage value investors step in and as they start buying into the market, we may see markets start to normalise. The next phase is seen as the recovery or upswing. The economy starts to stabilise, unemployment gradually starts to decline, consumer balance sheets start to look healthier and demand for credit starts to increase. As consumer demand and sentiment starts to look positive, sales and productivity start to rise and companies start increasing their inventory. As soon as the market gains momentum we see consumer spending starting to rise much faster, its pace is soon followed by growth in production and sales. Employment starts to improve as companies start investing and hiring more people. Soon shortages emerge in goods, services and skills. This, in turn, causes prices to be pushed up and central banks begin to increase interest rates in order to combat inflation. As the market starts to peak there is normally an overwhelming sense of optimism about the future. The fourth and final stage in the cycle (downswing) is marked with uncertainty. Once again, households fall under pressure resulting from high levels of debt, high interest rates and rising inflation. Credit demand starts to fall and will soon be followed by a decline in production and sales. Unemployment levels start to rise as companies start cutting costs and reducing their workforces. During this time certain sectors may still be performing well and, as a result, investors are not clear which direction the market will take.
In each decade markets have been positive for an average of 60% of the time. So even though the graph of the equity markets and table above attempts to depict a downward or upward trajectory - over that time period there could be intermittent positive or negative months. Looking at it from this point of view each investor could have a very different experience depending on when they decided to get into the market and when they decide to exit. We know that timing the market cycle is a feat that is near impossible, therefore looking at market fundamentals and not just being swayed by sentiment is extremely important. Investors need to set a firm foundation, clearly defining their level of risk, their time horizon and, ultimately and most importantly, be clear on their financial goals. By doing this, whether we are in the head rush of a bull stampede or being pulled under by the undercurrent of a grumpy bear, while others are trying to shine up their crystal ball, you can sit back and be secure in the decisions that you have made.