Detailed overview of TAMS data to change on 3 March
Background:
On 3 March 2014, the TAMS data will be updated as the final step in implementing the TAMS audit recommendations of April 2013 and marks the effective commencement date of the new TAMS expanded panel contract.

This article describes what these updates entail and looks at the potential impact on data users.
• The TAMS Universe will be updated to the AMPS 2013A household and individual Meter Universe, which incorporates the latest South African census data. DSTV audited subscriber figures for March 2013 will be used to update the DSTV Universe. The last TAMS update occurred on 14 January 2013.
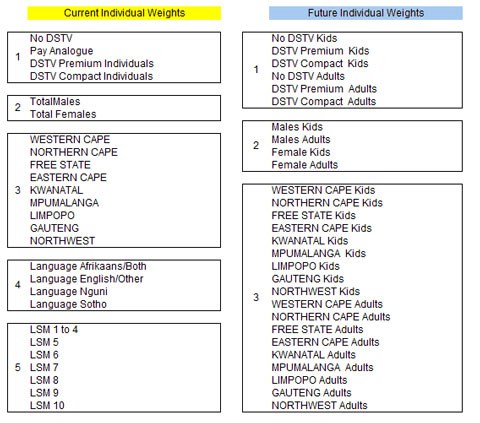
• The current weighting system used for TAMS is the Random Iterative Method - in short RIM weighting. The TAMS weighting regime will be adjusted where each weighting variable will be broken out into Children (Ages 4 to 14 years) and Adults (Ages 15+). The RIM weighting error arising from a coding error relating to the work status of children aged 4 to 6 will also be rectified at the same time. Both adjustments will enhance data stability and improve weighting efficiency.
• These updates will be applied to an increased weekly reporting sample of 2,500 households (Approximately 10,000 individuals delivered daily), following the recent TAMS panel expansion.
Benefits to data users:
The industry and data users will benefit from the 3 March 2014 update in the following ways:
• The TV Universe update will incorporate the population shifts emerging from the 2011 South African National Census as well as reflect shifts that have occurred in the TV audience landscape in the last year.
• Stability in commonly traded target markets will be enhanced by the expanded reporting sample as well as the breakouts of each weighting variable into children and adults. In particular, LSM groups that are frequently broken out by adults will benefit from the newly structured RIMS.
• Statistical measures demonstrating general sample and weighting health will improve. Weighting efficiency for individuals will increase from 48% to 68%. Simultaneously, the maximum weight will decrease from 99,000 to around 50,000, which will further contribute positively towards daily data stability.
TAMS universe update:
Television households in South Africa have increased from 12.1 Million to 12.8 Million, which represents a 5.7% growth.
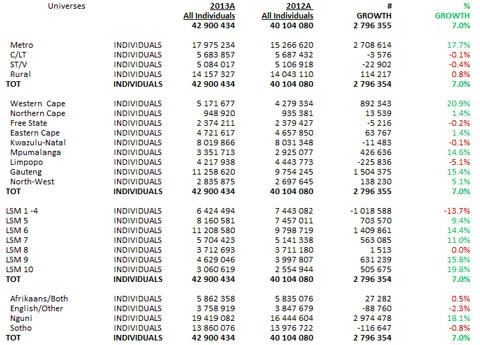
Due to the population shifts that emerged from the recent national census, the number of individuals (Ages 4+) who have access to a working TV set in home has grown by 7%, from 40.1 Million to 42.9 Million.
Table 1: Household Universe Comparisons (2013A against 2012A)
Table 2: All Individuals (Ages 4+) Universe Comparisons (2013A against 2012A)
Nguni speakers have grown considerably by 18%, whilst all other language groups have shown small declines. English speakers have the most notable decrease with 2.3%.
A significant increase in the television individuals has occurred in the metropolitan areas, with a 17.7% growth. This is in keeping with the trend of urban migration. Consequently, the provinces in which major metropolitan areas are situated, such as Gauteng and Western Cape, show large population increases. Western Cape has the biggest increase of 20.9%; followed by Gauteng with 15.4%. Conversely, KwaZulu-Natal exhibits a decline of 0.1%, where populations are more dispersed. Mpumalanga also stands out with a significant increase of 14.6%.
As a result of households acquiring more durable goods and low population growth in the rural areas, LSM 1 - 4 has declined by 13.7%. Apart from LSM 8, all other LSM groups have increased in size. In particular, LSM 9 and 10 have each increased by more than 15%, though off a smaller absolute base than the lower LSMs. Overall, the largest proportion of the South African television population falls within LSM 5 (8.2 Million) and LSM 6 (11.2 Million). This should be taken into consideration when working with ratings in thousands.
Adjustments to the TAMS weighting regime:
As stated above, each weighting variable will be broken out into Children (Ages 4 to 14 years) and Adults (Ages 15+) and at the same time the coding error relating to the work status of children aged 4 to 6 will also be rectified.
Table 3: Current and Future Weighting Regime
Impact of updates on the TAMS data:
To evaluate the potential impact that the March 2014 updates will have on the TAMS data, a test based on data from the 6th January to 19 January 2014, has been performed. A data set where the population updates and weighting changes were applied is compared to the live data structure.
• Test data = Meter Universe for 2013A, with new weighting structure (Table 3).
• Live data = Meter Universe for 2012A, with current weighting structure (Table 3).
Impact on Weighting Efficiency
The Weighting Efficiency which is a statistical measure of sample and weighting health improves considerably from 48% to 68% when the recommended weighting structure is applied. Simultaneously, the maximum weight decreases from 99,000 to around 50,000, which contributes positively to daily data stability.
Figure A: Weighting Efficiency Improvements
Impact on Viewing Data
The "shape of the day" graph below shows increases in viewing due to the actual growth of the television population in thousands. Prime-time in particular, benefits from the increase of 7% in the individuals Meter Universe.
Figure B: Shape of Day TV Ratings in 000s
However, it should be noted that when looking at the percentage ratings, the converse occurs. The percentage ratings reflect the finer changes that have occurred within the TAMS universe, and show slightly lower viewing levels. This decline may partly be attributed to the increases in the proportion of Nguni speakers in the new 2013A Meter Universe. Traditionally, Nguni speakers are the lightest viewers and display the lowest average time viewed (As seen in Table 4). However, it should be noted that the data updates and actual television viewing behaviour interact in complex ways.
Figure C: Shape of Day TV Ratings in %
Although Nguni speakers exhibit the lowest average time viewed (ATV), there is almost no change between the live data and test data in terms of their Total TV viewing. However, since Nguni speakers in the test data are proportionately higher, that ATV for Total individuals is slightly reduced from 1.25.10 hrs to 1.23.25 hrs. The drops in the ATV amongst English and Afrikaans speakers in the test data also contribute to this over decline ATV.
ATV for Free to air amongst All Individuals is slightly lower in the test data. DSTV Commercial remains unchanged.
Table 4: Average Time Viewed by Target Market
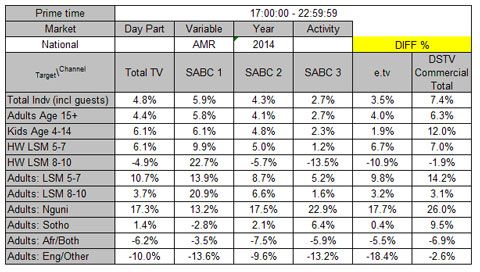
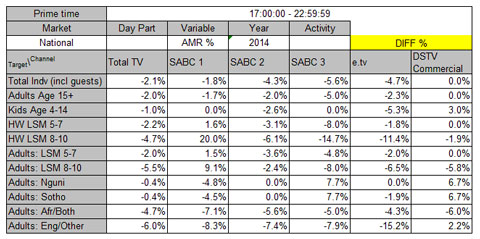
Table 5 (Differences when looking at TV Ratings in 000s) and Table 6 (Differences when looking at TV Ratings in %) below shows only the differences between the live data and test data during prime-time, for various commonly traded target markets. Please consult Appendix A for the referent detail.
In line with the Universe changes all TV channels show increased viewing numbers in thousand ratings for Total Individuals, particularly for SABC 1 and DSTV Commercial. As is to be expected and in line with Populations shifts, decreases in thousand ratings occur for Afrikaans and English speakers, and in some instances, Sotho speakers.
Overall, LSM 8 - 10 Housewives show lower thousand ratings. This is partly due to the removal of the work status weighting variable, where housewives were incorporated into its structure.
Table 5: Live and Test Data % Differences based on TV Ratings in 000s
Consistent with the Shape of the Day graph, percentage ratings are generally lower in the test data. Changes in the population have the least impact on SABC 1 and DSTV Commercial ratings.
Table 6: Live and Test Data % Differences based on TV Ratings in %
Summary
• The growth of 7% in the TAMS Universe will result in increases in ratings in thousands, especially during prime-time. Nguni speakers will in most instances show increases when looking at TV Ratings in 000s. Other Language groups may show decreases.
• TV Ratings in percentages will generally reduce slightly, partly due to the introduction of lighter viewers into the panel, and their greater representation in the updated TAMS Universe (i.e. more Nguni speakers).
• LSM 8 - 10 Housewives also show declines in the 000 Ratings as well as the % Ratings partly due to the removal of the work status weighting variable, where housewives were incorporated into its structure.
• Changes to the weighting regime will result in improved weighting efficiency and enhance data stability on commonly used target markets.
• These changes will be incorporated into the TAMS panel from 3 March 2014.
Notes for planners
• It must be noted that the profile and make up of most of the industry's major trading target markets will shift on 3 March making forecasting and planning over this period difficult.
• Unlike previous universe updates there are no general rules evident in terms of making adjustments and downweights to campaigns in the months ahead. The changes are multi-dimensional and playout different by target market and by channel.
• Income groups are not included in the RIM weights and therefore will be subject to fluctuations on a daily basis.
• From the implementation of these changes in March the TAMS panel will provide more stable results against most of the major industry trading target markets; in particular target markets defined by LSM and by adults.
Appendix A: Contains the outcomes of applying the 2013A Universe and new weighting structure.


