Green Monday spending jumps 13% to US$1.275bn
For the holiday season-to-date US$29.3bn has been spent online, marking a 13% increase versus the corresponding days last year. Green Monday (Dec. 10) reached US$1.275bn in spending, up 13% vs. last year and ranking as the third heaviest online spending day for the season-to-date after Cyber Monday (US$1.465bn) and Tuesday, Dec. 4 (US$1.362bn).
| 2012 Holiday Season To Date vs. Corresponding Days* in 2011 Non-Travel (Retail) Spending Excludes Auctions and Large Corporate Purchases Total US - Home & Work Locations (Source: comScore, Inc) | |||
|---|---|---|---|
| Millions (US$) | |||
| 2011 | 2012 | Percent Change | |
| November 1-December 10 | US$25,914 | US$29,259 | 13% |
| Thanksgiving Day (Nov. 22) | US$479 | US$633 | 32% |
| Black Friday (Nov. 23) | US$816 | US$1,042 | 28% |
| Thanksgiving Weekend (Nov. 24-25) | US$1,031 | US$1,187 | 15% |
| Cyber Monday (Nov. 26) | US$1,251 | US$1,465 | 17% |
| Green Monday (Dec. 10) | US$1,133 | US$1,275 | 13% |
*Corresponding days based on corresponding shopping days (3 November thru 12 December 2011)
"Green Monday kicked off this critical week for online holiday shopping with a strong total of US$1.275bn, marking a 13% gain from last year," said comScore chairman Gian Fulgoni. "While Green Monday remains a very important day for the season, as consumers have gained confidence with on-time shipment delivery, there is perhaps less urgency than there once was to make those final purchases at least two weeks in advance of Christmas Day. What we've seen over the past few years is a tendency for heavy spending to continue late into the week of Green Monday and right up until Free Shipping Day, which this year falls on December 17."
Green Monday gains driven by growth in number of buyers and spending per buyer
An analysis of Green Monday spending demonstrates how various components contributed to the 13% growth rate. Spending growth was driven by both an increase in the number of buyers (up 7% to 9 million) and an increase in spending per buyer (up 6% to US$140.95). The gain in spending per buyer primarily reflected an increase in the number of transactions per buyer (up 5% to 1.76) rather than an increase in the dollar value of a transaction, which was up only 2% to US$80.11. This likely reflects consumers' willingness to purchase at a variety of retailers to take advantage of competitive deals and discounts.
| Green Monday 2012 vs. Green Monday 2011Spending Breakdown Non-Travel (Retail) Spending Excludes Auctions and Large Corporate Purchases Total US - Home & Work Locations (Source: comScore, Inc) | |||
|---|---|---|---|
| 2011 | 2012 | % Change | |
| Total Spending (US$ Millions) | US$1,133 | US$1,275 | 13% |
| Buyers (000) | 8,570 | 9,044 | 7% |
| Spending per Buyer | US$132.20 | US$140.95 | 6% |
| Transactions (000) | 14,376 | 15,913 | 11% |
| Spending per Transaction | US$78.81 | US$80.11 | 2% |
| Transactions per Buyer | 1.68 | 1.76 | 5% |
Digital content & subscriptions remains top-gaining product category for season
The top-gaining category for the season-to-date is Digital Content & Subscriptions, predominantly comprised of digital book, music and video downloads, which has grown 22% versus year ago. Toys ranks second with a growth rate of 18%, followed by Video Game Consoles & Accessories (up 15%). Consumer Electronics currently ranks fourth (up 15%) on the strength of smartphone sales, while Computer Hardware rounds out the top five (up 14%) on the strength of tablet sales.
| Top Gaining Product Categories for Holiday Season-to-Date Nov. 1- Dec. 10, 2012 vs. Corresponding Shopping Days* in 2011 Total US - Home & Work Locations (Source: comScore, Inc) | |
|---|---|
| Percent Change | |
| Digital Content & Subscriptions | 22% |
| Toys | 18% |
| Video Game Consoles & Accessories | 15% |
| Consumer Electronics | 15% |
| Computer Hardware | 14% |
*Corresponding days based on corresponding shopping days (3 November thru 12 December 2011)
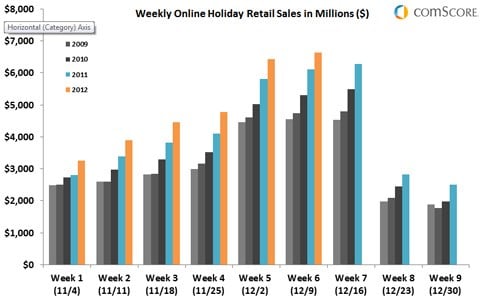
Weekly Online Holiday Retail Sales