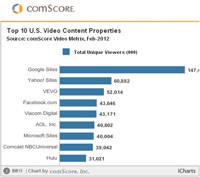
Top 10 video content properties by unique viewers
Google Sites, driven primarily by video viewing at YouTube.com, ranked as the top online video content property in February
with 147.4 million unique viewers, followed by Yahoo! Sites with 60.9 million, VEVO with 52 million, Facebook.com with 43.6 million and Viacom Digital with 43.2 million. Nearly 38 billion video views occurred during the month, with Google Sites generating the highest number at 16.7 billion, followed by Hulu with 951 million and Yahoo! Sites with 721 million. The average viewer watched 21.8 hours of online video content, with Google Sites (7 hours) and Hulu (3.8 hours) demonstrating the highest average engagement among the top ten properties.
| Top US Online Video Content Properties Ranked by Unique Video Viewers February 2012 Total US - Home and Work Locations Content Videos Only (Ad Videos Not Included) (Source: comScore Video Metrix) | |||
|---|---|---|---|
| Property | Total Unique Viewers (000) | Videos (000)* | Minutes per Viewer |
| Total Internet : Total Audience | 179,112 | 37,791,580 | 1,305.8 |
| Google Sites | 147,426 | 16,671,058 | 418.2 |
| Yahoo! Sites | 60,882 | 721,372 | 67.8 |
| VEVO | 52,014 | 696,969 | 60.5 |
| Facebook.com | 43,646 | 239,861 | 22.7 |
| Viacom Digital | 43,171 | 482,854 | 60.4 |
| AOL, Inc. | 40,802 | 442,308 | 46.1 |
| Microsoft Sites | 40,004 | 570,170 | 53.5 |
| Comcast NBCUniversal | 39,042 | 205,647 | 29.0 |
| Hulu | 31,021 | 950,969 | 226.5 |
| Turner Digital | 28,997 | 268,699 | 31.9 |
*A video is defined as any streamed segment of audiovisual content, including both progressive downloads and live streams. For long-form, segmented content, (e.g. television episodes with ad pods in the middle) each segment of the content is counted as a distinct video stream.
Americans viewed 7.5 billion video ads in February, with Hulu delivering a record-high number of video ad impressions at more than 1.5 billion. Google Sites ranked second with 1.1 billion video ads during the month, followed by Adap.tv with 706 million, BrightRoll Video Network with 683 million and Specific Media with 611 million. Time spent watching video ads totalled nearly 3.2 billion minutes, with Hulu delivering the highest duration of video ads at 650 million minutes. Video ads reached 50% of the total US population an average of 49 times during the month. Hulu delivered the highest frequency of video ads to its viewers with an average of 48, while ESPN delivered an average of 26 ads per viewer.
| Top US Online Video Ad Properties Ranked by Video Ads* Viewed February 2012 Total US - Home and Work Locations Ad Videos Only (Content Videos Not Included) (Source: comScore Video Metrix) | ||||
|---|---|---|---|---|
| Property | Video Ads (000) | Total Ad Minutes (MM) | Frequency (Ads per Viewer) | % Reach Total US Population |
| Total Internet : Total Audience | 7,495,201 | 3,184 | 49.1 | 50.0 |
| Hulu | 1,557,832 | 650 | 48.2 | 10.6 |
| Google Sites | 1,124,892 | 119 | 15.6 | 23.5 |
| Adap.tv† | 705,719 | 424 | 10.6 | 21.8 |
| BrightRoll Video Network** | 683,440 | 429 | 6.9 | 32.4 |
| Specific Media** | 611,076 | 302 | 7.0 | 28.5 |
| Tremor Video** | 491,050 | 264 | 11.4 | 14.1 |
| ESPN | 477,284 | 165 | 26.2 | 6.0 |
| Auditude, Inc.** | 411,726 | 174 | 10.5 | 12.8 |
| Microsoft Sites | 393,069 | 154 | 11.1 | 11.6 |
| TubeMogul Video Ad Platform** | 334,477 | 148 | 7.7 | 14.2 |
Note: Google Sites' video ad data includes a sizeable increase vs. previous months due to the recent inclusion of certain YouTube ad formats in our reporting. Any changes vs. previous months should not be treated as organic growth. In addition, Google Sites' video ad data currently does not include promoted videos on YouTube or homepage ads.
*Video ads include streaming-video advertising only and do not include other types of video monetisation, such as overlays, branded players, matching banner ads, homepage ads, etc.
**Indicates video ad network
†Indicates video ad exchange
The February 2012 YouTube partner data revealed that video music channels VEVO (50.8 million viewers) and Warner Music (29.9 million viewers) maintained the top two positions. Gaming channel Machinima ranked third with 22.9 million viewers, followed by Maker Studios Inc. with 14.4 million, FullScreen with 12 million and Warner Bros (The Ellen Show) with 9 million. Among the top 10 YouTube partners, Machinima demonstrated the highest engagement (64 minutes per viewer) closely followed by VEVO (61 minutes per viewer), while VEVO streamed the most videos (674 million) followed by Machinima (344 million).
| Top YouTube Partner Channels* Ranked by Unique Video Viewers February 2012 Total US - Home and Work Locations Content Videos Only (Ad Videos Not Included) (Source: comScore Video Metrix) | |||
|---|---|---|---|
| Property | Total Unique Viewers (000) | Videos (000) | Minutes per Viewer |
| VEVO @ YouTube | 50,755 | 674,126 | 60.5 |
| Warner Music @ YouTube | 29,893 | 185,032 | 27.7 |
| Machinima @ YouTube | 22,910 | 343,531 | 63.7 |
| Maker Studios Inc. @ YouTube | 14,432 | 155,108 | 47.1 |
| FullScreen @ YouTube | 11,999 | 54,648 | 19.0 |
| Warner Bros (The Ellen Show) @ YouTube | 8,992 | 38,543 | 17.8 |
| BroadbandTV @ YouTube | 8,626 | 37,847 | 16.4 |
| Big Frame @ YouTube | 8,072 | 42,810 | 20.1 |
| Clevvertv @ YouTube | 7,017 | 13,105 | 7.8 |
| Demand Media @ YouTube | 6,816 | 17,420 | 9.5 |
*YouTube Partner Reporting based on online video content viewing and does not include claimed user-generated content.
Other notable findings from February 2012 include:
comScore, Inc. (NASDAQ: SCOR) is a global leader in measuring the digital world and the preferred source of digital marketing intelligence.
Go to: http://www.comscore.com