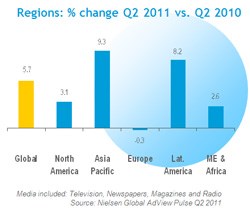
Nielsen reported that advertising revenue dropped in Q2 in 16 out of 36 global markets - the first significant decline since the Q3 2009 report when adspend fell in more than half the markets monitored at the height of the global recession. "Compared to the 8.9% growth rate in the first quarter of the year, there was definitely some slowdown," observed Randall Beard, Global Head of Advertiser Solutions for Nielsen. "But, based on the global economy and the financial problems many countries have experienced, a 5.7% increase for quarterly year-on-year global adspend is still great news." Global advertising in Q2 totalled US$127 billion (mainly based on published rate cards and four major media types), and the first half of 2011 closed with a +7.2% growth over the same period in 2010.
Declines in adspending for the fast moving consumer goods (FMCG) category in Europe and North America, and the continued decline of newspaper ads, also contributed to slower growth in these regions. However, in the USA, the world's largest ad market, these declines were off-set by increases in the automotive, insurance and financial service categories, which contributed to 3.1% overall growth in both the US and North America as a whole.
FMCG advertising posted its lowest quarterly growth since the Q1 2009 Pulse report: 4% globally with notable declines of -3.6% in Europe and -3.0% in North America. The decline in FMCG adspend was particularly surprising as the Easter holiday, traditionally a key occasion for FMCG and confectionary advertising in Europe and North America, took place in late April this year, which should have pushed more ad revenue to the beginning of Q2, noted Beard. Within FMCG, cosmetics and toiletries posted the most robust growth of 6.9% and accounted for nearly one in every ten dollars spent globally.
Interestingly, clothing and accessories, which was among the worst hit recession categories in 2009, posted the highest quarterly year-on-year increase in Q2 - up 17.9% globally, driven by hefty 27.9% increase in Asia Pacific, with a +39.8% increase in China.*
In Western Europe, quarterly adspend flat-lined with -0.3% growth and seven out of 12 European markets reported quarterly declines. Adspend in Germany, Europe's largest economy, reported an increase of 3.1% in Q2.
Asia Pacific posted the strongest regional growth in Q2 (+9.3%) with double-digit increases from Indonesia (18.9%), China (14.8%), Hong Kong (13.4%) and the Philippines (12.6%).*
Among 36 global markets covered by the Nielsen Global AdView Pulse, Argentina reported the highest year-on-year quarterly increase of 28.5%.
Globally, hardest hits markets in Q2 were Egypt (-51.7% YOY) where advertisers remained cautious amid the uncertain political and economic climate following the Arab Spring. Other double-digit declines were reported in Turkey (-12.9%), Taiwan (-11%) as well as Southern European markets of Spain (-12.6%) and Greece (-13.7%).*
While radio posted the most robust percentage increase among all traditional media in Q2 (+8.2%), overall television continued to dominate global advertising and increased its share of voice and spend. In the first half of 2011, television ads attracted US$65 out of every US$100 spent on advertising globally, up from US$63.70 one year ago. "According to Nielsen, overall TV viewership continues to grow," said Beard. "In the US, TV viewing increased 22 minutes per month per person over last year. So the medium remains the dominant source of video content for all demographics."
*based mainly on published rate cards and the four major media types
The external data sources for the other countries included in the report are:
Argentina: IBOPE
Brazil: IBOPE
Egypt: PARC (Pan Arab Research Centre)
France: Yacast
Greece: Media Services
Hong Kong: admanGo
Japan: Nihon Daily Tsushinsha
Kuwait: PARC (Pan Arab Research Centre)
Lebanon: PARC (Pan Arab Research Centre)
Mexico: IBOPE
Pan-Arab Media: PARC (Pan Arab Research Centre)
Portugal: Mediamonitor
Saudi Arabia: PARC (Pan Arab Research Centre)
Spain: Arce Media
Switzerland: Nielsen in association with Media Focus
UAE: PARC (Pan Arab Research Centre)
The Nielsen Company is a global information and media company with leading market positions in marketing and consumer information, television and other media measurement, online intelligence, mobile measurement, trade shows and business publications. For more information, go to www.nielsen.com.
Go to: http://www.nielsen.com