According to the statement from SAARF, while print users can now compare current with previous readership figures, there will be little for them to evaluate. Overall, it says, print readership remained stable, with both total newspaper and magazine readership unchanged. Very few publications showed any significant change in their readership figures. Across both print sectors, only 22 titles registered any real change, and of these, only five were positive movements.
While print consumption remained stable, the incidence of both television viewing and radio listening increased, as did access to the Internet. Exposure to out-of-home declined in general, while cinema attendance was stable.
Media aside, another significant change to AMPS June 10 is the introduction of the new 2010 population estimates produced by the Bureau of Market Research (BMR). This estimate has substantially changed the makeup and size of the SA population projection, says SAARF, although users can still compare the current survey with the previous.
Technical information
Universe
UNISA's BMR recently released new population estimates for 2010. In the absence of current census data, SAARF points out that all its media research must instead rely on population estimates. Almost 10 years have elapsed since the last national census, and results from the upcoming 2011 census are only expected around 2014.
It is therefore necessary, continues SAARF, to make projections on the growth of the South African population, based on various sources, so that the SAARF research products can remain up-to-date.
The AMPS Jun 10 universe has been updated to reflect BMR's new estimates for the 15+ population: 34,020 million adults, which is an increase of 1,522 million (up 4.7%).
Users should be aware of the following significant changes to the population profile:
BMR believes there are a number of reasons behind the marked difference between its earlier estimates and the new 2010 estimate.
Below is a breakdown of the 15+ population, based on the BMR 2010 population estimate.
| 2009 | 2010 | ||||
| '000 | % | '000 | % | ||
| Total adults 15+ | 32 498 | 100 | 34 020 | 100 | |
| Sex | |||||
| Male | 16 206 | 49.9 | 16 113 | 47.4 | |
| Female | 16 292 | 50.1 | 17 907 | 52.6 | |
| Age | |||||
| 15-24 | 9 283 | 28.6 | 10 049 | 29.5 | |
| 25-34 | 7 575 | 23.3 | 7 748 | 22.8 | |
| 35-49 | 8 460 | 26 | 8 568 | 25.2 | |
| 50+ | 7 180 | 22.1 | 7 655 | 22.5 | |
| Population group | |||||
| Black | 24 623 | 75.8 | 25 613 | 75.3 | |
| Coloured | 2 856 | 8.8 | 2 943 | 8.7 | |
| Indian | 854 | 2.6 | 927 | 2.7 | |
| White | 4 165 | 12.8 | 4 538 | 13.3 | |
| Community size | |||||
| 250 000+ | 11 117 | 34.2 | 11 541 | 33.9 | |
| 40 000-249 999 | 4 259 | 13.1 | 4 626 | 13.6 | |
| 500 -39 999 | 4 104 | 12.6 | 4 148 | 12.2 | |
| Less than 500 rural | 13 018 | 40.1 | 13 706 | 40.3 | |
| Province | |||||
| Western cape | 3 194 | 9.8 | 3 523 | 10.4 | |
| Northern cape | 802 | 2.5 | 718 | 2.1 | |
| Free State | 2 069 | 6.4 | 2 210 | 6.5 | |
| Eastern Cape | 4 879 | 15 | 4 734 | 13.9 | |
| KwaZulu-Natal | 6 628 | 20.4 | 7 148 | 21 | |
| Mpumalanga | 2 423 | 7.5 | 2 340 | 6.9 | |
| Limpopo | 3 550 | 10.9 | 3 752 | 11 | |
| Gauteng | 6 808 | 20.9 | 6 883 | 20.2 | |
| North West | 2 144 | 6.6 | 2 712 | 8 | |
| Metropolitan Area | |||||
| Cape Town | 2 086 | 6.4 | 2 298 | 6.8 | |
| Cape Town Fringe | 301 | 0.9 | 332 | 1 | |
| PE/Uitenhage | 878 | 2.7 | 853 | 2.5 | |
| East London | 400 | 1.2 | 386 | 1.1 | |
| Durban | 1 918 | 5.9 | 2 063 | 6.1 | |
| Pietermaritzburg | 347 | 1.1 | 372 | 1.1 | |
| Kimberley | 150 | 0.5 | 133 | 0.4 | |
| Bloemfontein | 301 | 0.9 | 317 | 0.9 | |
| Welkom | 186 | 0.6 | 199 | 0.6 | |
| Vaal | 679 | 2.1 | 705 | 2.1 | |
| Greater Johannesburg | 1 954 | 6 | 1 934 | 5.7 | |
| Soweto | 925 | 2.8 | 907 | 2.7 | |
| Reef | 2 662 | 8.2 | 2 721 | 8 | |
| Pretoria | 1 332 | 4.1 | 1 344 | 4 |
Only statistically significant differences are quoted, and are based on percentages, not on number of people.
The LSMs of AMPS Jun 10 are comparable to AMPS December 09, with only one significant shift - LSM 2 has declined from 7.5% to 6.5%, particularly in metros, Limpopo, the female demographic and the 15-24 age group.
Several household income groups have shown significant changes over AMPS December 09.
| Household income groups | AMPS December 09 | AMPS Jun 10 | Significant change? |
|---|---|---|---|
| Up to R 799 | 5.9% | 5.3% | DOWN |
| R800-R1 399 | 16.4% | 13.9% | DOWN |
| R1 400-R2 499 | 14.6% | 13.7% | DOWN |
| R2 500-R4 999 | 19.0% | 20.0% | UP |
| R5 000-R7 999 | 13.9% | 14.7% | STABLE |
| R8 000-R10 999 | 10.0% | 10.5% | STABLE |
| R11 000-R19 999 | 10.4%% | 11.5% | UP |
| R20 000+ | 9.9% | 10.3% | STABLE |
Average household income now stands at R7 473.00 per month, an increase of 2.4% (up from R7 295.00 in AMPS December 09). The six-month change is slightly behind inflation, at 6.2% (Jan 2010).
Employment status
Education levels
There has been no change in the literacy rate, which remains at 96.5%.
Schooling levels have also remained stable, although there has been in increase in the percentage of adults holding a matric certificate - up from 29.8% in AMPS December 2009 to 31.1% currently. These improvements have occurred in Gauteng and among 15-24-year-olds.
The household weighting procedure is identical to that used in the previous two AMPS releases. Household results are therefore comparable across these releases.
The household population stands at 13.369 million, an increase of 7.1% or 885 000. This increase is a result of the new 2010 BMR population estimates, as discussed above.
The SAARF TAMS household universe also increases significantly, rising from 9.708 million (77.8%) to 10.583 million (79.2%).
Access to services
Services have remained stable over the previous AMPS release. The only changes seen were a significant decline in the incidence of flush toilets, and a significant increase in access to cellphones.
| AMPS December 09 | AMPS Jun 10 | Significant change? | |
|---|---|---|---|
| Electricity | 90.3% | 90.6% | STABLE |
| Water in house/on plot | 77.0% | 77.8% | STABLE |
| Geyser - hot water | 39.3% | 38.7% | STABLE |
| Flush toilet | 64.0% | 62.1% | DOWN |
| Cell phone | 71.3% | 73.8% | UP |
| Home telephone | 15.4% | 15.2% | STABLE |
Durables and entertainment in the home
Media audience results
This report compares data from two AMPS releases:
Only statistically significant differences are quoted, and are based on percentages, not on number of people.
With AMPS Jun3 2010, the industry now has access to the first totally comparable DS-CAPI readership results. As the second, full, 12-month DS-CAPI survey, this survey marks the new trend line for print.
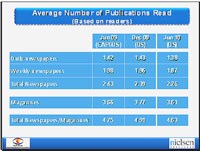
Overall, the print medium has remained stable. Total print readership is set at 64.1%, with 21,799 million readers. While up slightly from AMPS December 09's 63.1%, this upward trend is not statistically significant.
Newspapers
Newspaper readership remains unchanged. While there has been growth of the overall newspaper audience in Limpopo, there was no other movement in the sector as a whole. Average issue readership (AIR) is 16.206 million, giving newspapers a reach of 47.6%.
Only eight titles across the total newspaper sector saw any change in their readership, with only one of these achieving growth. Of the rest which saw their AIRs declining, half of these were weekend titles.
The rising Son
Son was the only newspaper title to show growth over AMPS December 2009. With its AIR increasing from 2.4% to 2.9%, the paper now has an audience of 984 000, compared to a total of 776 000 previously. This growth was thanks primarily to readership gains in metros, the Eastern Cape, particularly Port Elizabeth/Uitenhage, gains in the male market and in the 35-49 age bracket.
Seven other newspapers showed significant downward shifts in their readership figures.
Magazines
Like newspapers, magazine readership has levelled off. The increased levels enjoyed by the medium over the last two AMPS releases, when the introduction of DS-CAPI resulted in a significantly higher measure for the sector, have now stabilised.
Total magazine readership is stable at 49.8%, with a total readership of 16,937 million. Upward shifts took place in Limpopo.
The only category to show significant change was that of fortnightly titles, which dropped from 14.9% to 13.7%, with a readership of 4,663 million.
The AIRs for the other magazine categories are:
At the level of individual titles, there was more movement in the magazine category than in newspapers. Four titles improved their AIRs. A further 10 titles saw their audiences decline, though not enough in total to affect the medium itself.
Magazine movers
Drum grew its AIR significantly from 7.1% to 7.9%, with a total audience of 2.673 million readers. Growth occurred in metros, Gauteng and on the Reef, and among 25-34-year-olds.
Also on the rise was Dish/Skottel, which now has a readership of 2.262 million, up from 1.798 million in the previous release. The title's AIR is now 6.6%, up from 5.5% previously. This growth came through from several areas: metros, the Eastern Cape and Gauteng, Port Elizabeth/Uitenhage, East London, Durban and Johannesburg, as well as the 15-34 age group.
You Pulse/HuisgenootPols saw its readership rise from 0.4% to 0.7%, with a total readership of 246 000. Upward audience shifts occurred in Gauteng, among males and 15-34 year olds.
Finally, alternate monthly Vuk'uzenzele rounds off the group of four titles showing growth. The publication now has 1,455 million readers and a reach of 4.3%, up from 3.6% previously. Demographic shifts occurred in the Free State, in East London, and among males and 35-49-year-olds.
Ten more magazine titles showed significant readership shifts over the previous AMPS release.
(SAARF TAMS is the official currency for the television industry.)
They might not be reading more, but South African adults are certainly watching more television. The 2010 FIFA World Cup would certainly have contributed here, with fieldwork covering the first two weeks of this event.
Total television viewing over a seven-day period is significantly up compared to AMPS December 2009 - from 85.5% previously to 86.8% currently. This increased TV universe is now 29.519 million strong, with gains occurring in metros, Limpopo and Gauteng, on the Reef, among males and 15-34 year olds.
Following are the weekly viewing figures for the country's TV channels:
Radio
(SAARF RAMS is the official currency for the radio industry.)
Like television, radio listening is up in total. Total radio listenership over a weekly period rose from 89.3% to 90.5%, with gains in Limpopo, the Vaal and among those aged 50+. The medium now reaches 30.795 million adults.
Radio's growth has come from the commercial and PBS radio sector, which showed increased listenership figures in total. These stations now reach 87.7% of South African adults, up from 86.7%. Growth occurred in Limpopo, the Vaal, among females and those aged 50+.
Total community radio remained stable with 24.1% listenership (8,204 million listeners, with more Bloemfontein listeners over the previous survey.)
(SAARF OHMS is the official currency for the out-of-home industry.)
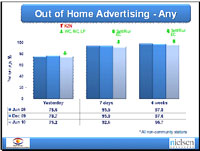
AMPS June 10 shows that in total, people's exposure to out-of-home media has declined over the previous survey.
Across an average week, exposure to all types of out-of-home media declined from 93.8% previously to 92.6%, with significant declines seen in settlements and rural areas, and in the Eastern Cape.
Individual out-of-home channels which showed significant changes over AMPS December 2009 were:
Cinema
Cinema attendance is stable in total, with no demographic shifts.
Internet
Access to the Internet has grown significantly over the previous AMPS release, across all time filters, and driven by greater connectivity in the 15-34 market.
Fo more, go to www.saarf.co.za.